Open Access
Fig. 2
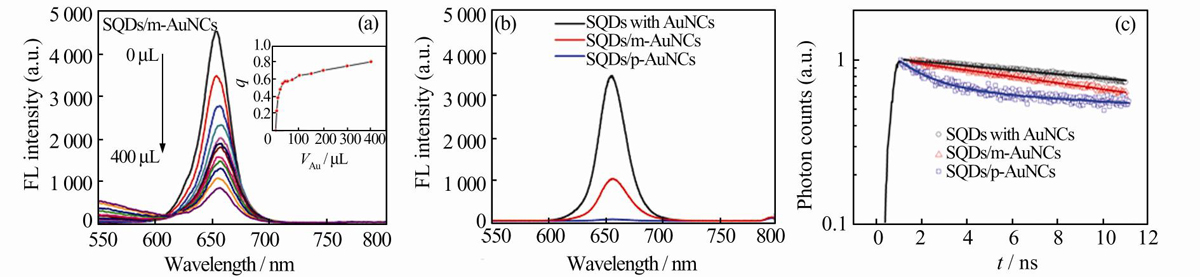
Quenching fluorescence of CdSe SQDs by p-AuNCs and m-AuNCs in suspensions
Download original image
(a) Quenched fluorescence spectra of SQDs with different amounts of m-AuNCs. The variance of quenching efficency with the VAu is shown in the illustration. Quenched fluorescence spectra (b) and normalized TRFL (c) of SQDs with p-AuNCs or m-AuNCs
Current usage metrics show cumulative count of Article Views (full-text article views including HTML views, PDF and ePub downloads, according to the available data) and Abstracts Views on Vision4Press platform.
Data correspond to usage on the plateform after 2015. The current usage metrics is available 48-96 hours after online publication and is updated daily on week days.
Initial download of the metrics may take a while.