Open Access
Fig. 12
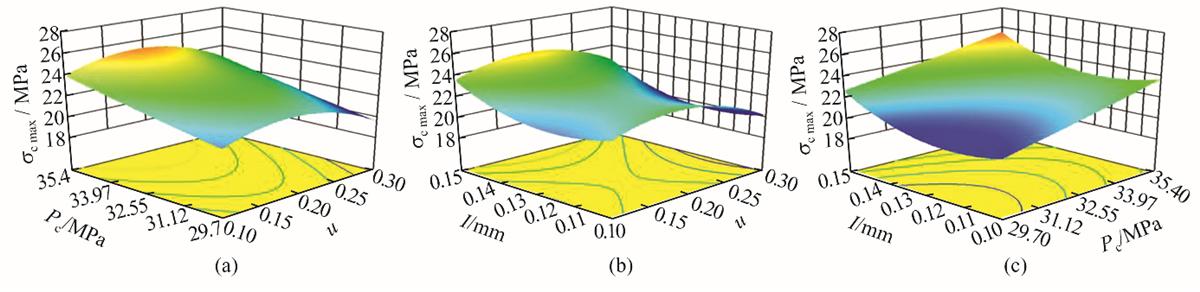
Surface diagram of contact stress response of sealing surface with the maximum contact stress as the index under the interaction of preload force Pc, friction coefficient u and interference fit I
Download original image
Current usage metrics show cumulative count of Article Views (full-text article views including HTML views, PDF and ePub downloads, according to the available data) and Abstracts Views on Vision4Press platform.
Data correspond to usage on the plateform after 2015. The current usage metrics is available 48-96 hours after online publication and is updated daily on week days.
Initial download of the metrics may take a while.