| Issue |
Wuhan Univ. J. Nat. Sci.
Volume 26, Number 6, December 2021
|
|
|---|---|---|
| Page(s) | 527 - 534 | |
| DOI | https://doi.org/10.1051/wujns/2021266527 | |
| Published online | 17 December 2021 | |
Environmental Science
CLC number: X24
Raw Material Consumption Controls on Environment Impacts of Sofa Production: A Case Study Based on Ecological Footprint
1
Research Institute of Forestry Policy and Information, Chinese Academy of Forestry, Beijing 100091, China
2
Operation Centre, Chongming Dongtan Nature Reserve of Shanghai City, Shanghai 202162, China
3
Department of Biological Sciences, Xinzhou Teachers University, Xinzhou 034000, Shanxi, China
† To whom correspondence should be addressed. E-mail: This email address is being protected from spambots. You need JavaScript enabled to view it.
Received:
20
June
2021
Abstract
Wooden furniture production consumes a lot of forest resource and other resources, so it is important to estimate its environmental effect. In this research, we collected data in a sofa factory of China and appraised its environment impacts by the ecological footprint (EF) methodology. The results showed that the total EF of the sofa factory was 2 316.25 gha/year (gha: global hectare). The average EF of a sofa was 0.18 gha/year. For the total EF of the sofa factory, main contribution came from wooden materials (55%), followed by non-wooden materials (41.26%), and these two categories contributed above 96% of the total EF. Human labor accounted for 2.21% of the total footprint. The built land and water contributed a little to the total EF. For the total EF of the wooden materials, main contribution came from wood beams (57.6%), followed by plywood (41.08%); and for the total EF of the non-wooden materials, main contribution came from sponge (95.37%). In the end, we concluded that the incorporate of recycled wooden material and reused sponge in the sofa production could be viewed as an important strategy to achieve more sustainable manufacturing.
Key words: case study / ecological footprint (EF) / the percent contribution / sofa factory
Biography: LI Jianquan, male, Professor, Ph. D., research direction: forest product market and trade, forestry policy and world forestry hot issues. E-mail: This email address is being protected from spambots. You need JavaScript enabled to view it.
Foundation item: Supported by the Fundamental Research Funds for the Central Non-profit Research Institution of CAF (CAFYBB2019MB002) , and State Forestry Administration of the People’s Republic of China (2015-R04)
© Wuhan University 2021
 This is an Open Access article distributed under the terms of the Creative Commons Attribution License (https://creativecommons.org/licenses/by/4.0), which permits unrestricted use, distribution, and reproduction in any medium, provided the original work is properly cited.
0 Introduction
The notion of ecological footprint (EF) was introduced in 1996 by Rees and Wackernagel which was defined as the area of land hypothetically required to provide the resources and to absorb the waste generated by a human population[1]. EF was an effective tool to investigate environmental awareness[2], environmental quality[3], effect of the COVID-19 pandemic on society[4] and so on. Recently, EF has been also applied to enterprises which are also considered as the organizations that require goods, services and generate waste[5].
EF can be used to measure the occupation of ecological resources by enterprises, which is helpful to understand the environmental cost of the enterprises. An appropriate definition of the EF for the corporate level is that it determines the space required to support an activity by means of the area needed to provide the resources consumed and to absorb the wastes generated[1,6,7]. It is estimated by converting all the material consumption and waste generated data of enterprises into the corresponding ecologically productive land area. The ecologically productive land area can be divided into six categories: energy land, degraded or built land, gardens, crop land, forests and sea space[8]. Based on the basic principles of the EF, we can establish the accounting model for the EF calculation of an enterprise, which can quantitatively reveal the ecological needs of enterprises.
Although EF has been applied to analyze the environment impacts of production processes for some products, such as nectarine production[9], mobile phones[10], textile sector[11], footwear[12], ceramic bricks production[13], drinking water bottles[14], water supply[15], apple production[16], production of wine[17], jackets manufacture[7], and a particleboard manufacturing process[18], there were no previous works regarding the application of the EF methodology to wooden furniture production in peer-reviewed scientific literature although it has important roles in resource utilization and forest conser vation.
In this study, we calculated the EF of a sofa factory to estimate its environmental impacts. The study will provide instructions for creating green factories and developing ecological economy, and provide scientific basis for enterprises to reduce emissions and achieve carbon neutrality.
1 Materials and Methods
1.1 Description of the Manufacturing Process
The sofa manufacturing process was investigated in a factory in China and shown in Fig. 1. The first step is to prepare wood and wood-based panels and to select the materials from them according to the different types, and then machine the selected materials into sofa framework; at the same time, prepare the fabrics for sofa, and then loft them, clip and sew the fabrics into the suitable sofa cover. The second step is to spread out both framework and cover, match and stitch them into the final products, inspect the final products and package them, and finally put them in storage area.
 |
Fig. 1 Diagram of the sofa manufacturing process |
1.2 EF
The EF of sofa production was obtained by summing up the EF of all the material consumed and waste generated during the production process based on the methods of Kitzes and Wackernagel[19]. In the calculation, equivalence factors are used to transform the results expressed into global hectare (gha) over hectares (hm2). The equivalence factors are shown in Table 1[20]. The data used in this study were grouped into the following categories: human labor, built land, water, machinery, wooden raw material (wood beam, medium density fiberboard, plywood), non-wooden raw materials (adhesive, cotton fabric, leather, steel, iron, sponge, imitation leather, microfiber, slider and packaging materials), and electricity. The raw material consumption value in the process of sofa production was obtained from the data of the invested factory in 2015.
Equivalence factors of different kinds of productive land gha·hm-2
1.2.1 Determination of the EF of human labor
The value of the average EF per capita in China is used as a proxy for the average EF per employee in this sofa factory. The EF of all the employees working in product related activities is then calculated by multiplying by the number of employees and then adjusted by working hours per year[9,16].
1.2.2 Determination of the EF of built land
EF of built land is determined by (1)where EFwb (gha·year-1) is weighted EF of built land, S (hm2·year-1) is surface area consumed, efb (gha·hm-2) is equivalence factor of built land.
The land used directly is considered to have the productivity of agricultural land, since most of the infrastructure and built environment are located in areas of agricultural quality[21].
1.2.3 Determination of the EF of water consumption
The forest is considered as a water producer, whereby the consumption of this resource is included in that of forest land. In order to calculate forest productivity, the hypothesis that a forest of wetlands can produce 1 500 m3 of fresh water per hectare per year is assumed[21]. Therefore, the formula employed for the calculation of the EF of water consumption is: (2)where EFww (gha·year-1) is weighted ecological footprint of water consumption, W (m3) is water consumption, FP(m3·hm-2·year-1) is forest productivity, and eff (gha·hm-2) is equivalence factor of forests.
1.2.4 Determination of the EF of machinery
Machinery plays an important role in sofa production. It affects the quality of product, the speed of production, and the degree of environmental pollution. The EF of machinery should not be ignored. (3)
(3) (4)where k (sej/CNY, sej: solar emjoule) is emergy/money ratio, U (sej) is total used emergy, R(sej) is renewable emergy, N(sej) is non-renewable emergy I (sej) is input emergy, O(sej) is output emergy, and GNP(CNY) is Gross National Product in China [22-29].
 (5)where EFm (gha·year-1) is the EF of machine, p (CNY) is the price of machine, y (year) is the working years of machine, and d (sej·hm-2) is global average energy density.
The ecological footprint of machinery is allocated to CO2 absorption land.
1.2.5 Determination of the EF of wooden raw materials
Wooden raw materials are used for supporting parts of sofa. In the factory, wooden raw materials of sofa include wood beam, medium density fiberboard and plywood. The total wood consumption value and the EF of wooden raw materials are determined by (6)where V (m3) is the total wood consumption value, Ti is wood conversion coefficient of raw material i (Table 2), and vi (m3) is the consumption value of wooden raw material i.
 (7)where EFwm is the EF of wooden raw materials, and NP is the natural productivity of wood.
The ecological footprint of the wooden raw material is allocated to forest.
Wood conversion coefficient of raw material
1.2.6 Determination of the EF of electricity
In China, 78%, 2% and 20% of electricity was generated from fossil fuels (mainly from coal), nuclear and renewable sources, respectively[29]. It is assumed that renewable energies have very high energy productivity (EP)[1]. The construction of wind parks and hydraulic plants has minimal emission and their energy footprint is considered irrelevant compared with the energy footprint from fossil fuels and nuclear energy.
The ecological footprint of electricity is determined using the following expression (8)where EFwe (gha·year-2) is weighted ecological footprint of electricity consumption, Pj (J) is primary energy consumption of source j, and EPj (J·hm-2·year-1) is energy productivity of source j.
The EP and the efficiency factor for electricity production of various energy sources are shown in Table 3[21,32].
The ecological footprint of electricity is allocated to CO2 absorption land.
EP and the efficiency factor of various energy sources
1.2.7 Determination of the EF of non-wooden raw materials
Non-wooden raw materials for sofa production include adhesive, cotton fabric, leather, steel, iron, sponge, imitation leather, microfiber, slider and packaging materials.
In the factory, imitation leather and microfiber were made of synthetic fabric. Slider belonged to metal accessories. All packaging materials were made of plastic.
The EF of non-wooden materials as well as the EF of packaging materials is determined using the following expression (9)where EFnwm (gha·year-1) is the weighted EF of non- wooden materials or packaging materials, Cmi (kg) is the consumption of material i, Esemi (J·kg-1) is the specific embodied energy of material i (Table 4) and EP (J·hm-2·year-1) is the energy productivity (oil).
The EF of sponge is calculated in the method described in Section 1.2.4 due to the absence of energy intensity.
The ecological footprint of the non-wooden materials is allocated to CO2 absorption land.
Embodied energy of material
2 Results
2.1 Total and Componential EF of the Sofa Factory
In total, we estimated the EF of the sofa factory was 2 306.25 gha·year-1 by summing up all the consumption for producing sofa. The average EF of a sofa produced was 0.18 gha·year-1. Concretely, the EF of the human labor was 51.3 gha·year-1 based on the EF per capita of 2.2 gha year-1 in China[34]. The EF of the built land was 2.69 gha year-1 based on the area of 1.07 hm2 and an equivalence factor of 2.51 gha/hm2. The EF of the water consumption in the factory was 0.29 gha·year-1 based on water consumption of 350 m3·year-1. The EF of the machinery was 21.49 gha·year-1. The EF of the wooden raw material yielded a figure of 1 274.05 gha·year-1 based on the natural productivity of wood in the world of 1.29 m3·hm-2 according to the research of Li et al[35], The EF of the non-wooden raw materials reached to 955.51 gha·year-1. The EF of electricity was 10.92 gha·year-1 (Fig. 2).
 |
Fig. 2 The componential EF of the sofa factory |
2.2 Total and Componential EF of Wooden Raw Materials for Producing Sofa
Wooden raw materials for sofa production include wood beam, medium density fiberboard and plywood. The total EF of wooden raw materials was 1 274.0 gha·year-1 by summing up all the componential EFs. The EF of wood beam, medium density fiberboard and plywood was 733.85, 16.86 and 523.35 gha·year-1, respectively (Fig. 3).
 |
Fig. 3 The componential EF of the wooden raw materials |
2.3 Total and Componential EF of Non-Wooden Raw Materials for Producing Sofa
Non-wooden raw materials for sofa production include adhesive, cotton fabric, leather, steel, iron, sponge, imitation leather, microfiber, slider as well as packaging materials. The EF of adhesive, cotton fabric, leather, steel, iron, imitation leather, microfiber and slider were calculated in the method described in Section 1.2.6. The EF of sponge was calculated in the method described in Section 1.2.4 due to the absence of its energy intensity. The total EF of non-wooden raw materials was 955.51 gha·year-1 by summing up all the componential EFs. The EF values of adhesive, iron, microfiber, slider, steel, cotton fabric, imitation leather, leather, packaging materials and sponge were 0.000 3, 0.93, 0.29, 0.64, 0.51, 20.99, 4.76, 3.56, 12.36 and 911.47 gha·year-1, respectively (Fig. 4).
 |
Fig. 4 The componential EF of the non-wooden raw materials |
2.4 Contributions of Different Components to the Total EF of the Sofa Production
Figure 5 shows the contributions of different components to the total EF of sofa production. In the total EF of the sofa production, the main contribution came from wooden materials (55%), followed by non-wooden materials (41.26%), and these two categories contributed above 96% of the total EF. Human labor accounted for 2.21% of the total footprint. The built land and water contributed a little to the total EF, the former accounted for 0.12%, and the later for only 0.01%.
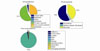 |
Fig. 5 Percent contributions of different components to the total EF of sofa production |
In the total EF of the wooden raw materials, the main contribution came from wood beam (57.6%), followed by plywood (41.08%), and these two categories contributed above 98% of the total EF. Medium density fiberboard only accounted for 1.32% of the total footprint.
In the total EF of the non-wooden raw materials, the main contribution came from sponge (above 95%). Cotton fabric accounted for 2.21% of the total footprint. Packaging materials accounted for 1.28% of the total footprint.
3 Discussions
3.1 EF as a Powerful Tool for Manufacturers
Sustainability in the manufacturing sector is essential in the process of sustainable development for the whole society[36]. Sustainable manufacturing is defined as “the creation of manufactured products that use processes that are non-polluting, conserve energy and natural resources, and are economically sound and safe for employees, communities, and consumers”[37]. Gaussin et al[36] and Joshi et al[38] emphasized the importance of reduce, reuse and recycle in the process of improving sustainability in the product manufacturing process. EF could help manufacturers analyze the productive processes and decrease environmental impacts. In our study, the total EF of the sofa factory was mainly influenced by the raw material, especially by the wooden material and sponge due to their high requirements. Therefore, strategies to reduce the EF for this sofa factory could focus on using recycled wooden material and reused sponge.
Although EF is an effective approach to measure the environmental impacts of products, its application to product is sometimes impeded due to the absence of data. Fortunately, science and technology development helps us solve this problem. The sofa factory we investigated adopts Enterprise Resource Planning (ERP) information management system in its logistics management. By using ERP, each kind of goods has its own unique bar code. Staff members can get the information of the goods by scanning bar code, which allows us to get all data in the sofa production process accurately and efficiently. Therefore, our results were relatively reliable and the method we used also can be used for other related studies.
3.2 EF as a Powerful Tool for Consumers
The product EF is a measure of ecoefficiency as it expresses the ecological impact per unit of product[16]. In our study, the sofa EF was 0.18 gha per item. In the same way, Saravia-Cortez et al[18] showed the particleboard EF ranged from 0.896 to 0.020 gha/m3 corresponding to the ratio of recycled wood wastes employed ranged from 0 to 100%. Cerutti et al[9] calculated the total footprint was 1.34 gha/t nectarines produced in an orchard in Piedmont (Italy). Cerutti et al[39] reported that the EF was 0.93 gha/t in nectarine production systems and was 8.04 gha/t in hazelnut production systems. The EF can be used to compare the ecological impact of the same products and different products. Therefore, if the EF value can be shown on the side of the packaging as an eco-label, consumers would conduct comparisons and express their ecological preferences.
At the present, limited information directly related to environmental impacts of products is available to the consumers despite their rising consumer environmental awareness. We suggest the EF methodology should be applied to a wider range of products in order to make it as a practical market tool to guide the consumers for choosing environment-friendly products.
4 Conclusion
We successfully assessed the environmental impacts of the sofa factory in China by applying the EF method. The EF of the sofa factory was 2 316.25 gha/year, of which 1 274.0 gha/year was from the wooden material and 911.47 gha/year was from sponge. These two components yielded the most significant impact on the total EF. Therefore, the incorporate of recycled wooden material and reused sponge in the sofa production could be viewed as an important strategy to achieve more sustainable manufacturing.
Acknowledgments
The authors gratefully thank the manager and field technicians of the sofa factory for their collaboration. An acknowledgment also goes to China National Furniture Association (CNFA) for its excellent work in coordination.
References
- Wackernagel M, Rees W. Our Ecological Footprint: Reducing Human Impact on the Earth [M]. Philadelphia: New Society Publishers, 1996. [Google Scholar]
- Simsar A. Young children’s ecological footprint awareness and environmental attitudes in Turkey [J]. Child Indicators Research, 2021, 14(4): 1387-1413. [Google Scholar]
- Koyuncu T, Beser M K, Alola A A. Environmental sustainability statement of economic regimes with energy intensity and urbanization in Turkey: A threshold regression approach [J]. Environmental Science and Pollution Research, 2021, 28(31): 42533-42546. [CrossRef] [PubMed] [Google Scholar]
- Echegaray F. What POST-COVID-19 lifestyles may look like? Identifying scenarios and their implications for sustainability [J]. Sustainable Production and Consumption, 2021, 27: 567-574. [CrossRef] [PubMed] [Google Scholar]
- Butnariu A, Avasilcai S. Research on the possibility to apply ecological footprint as environmental performance indicator for the textile industry [J]. Procedia-Social and Behavioral Sciences, 2014, 124: 344-350. [CrossRef] [Google Scholar]
- Monfreda C, Wackernagel M, Deumling D. Establishing national natural capital accounts based on detailed ecological footprint and biological capacity assessments [J]. Land Use Policy, 2004, 21: 231-246. [Google Scholar]
- Herva M, Álvarez A, Roca E. Combined application of energy and material flow analysis and ecological footprint for the environmental evaluation of a tailoring factory [J]. Journal of Hazardous Materials, 2012, 237-238: 231-239. [CrossRef] [PubMed] [Google Scholar]
- Bicknell K B, Ball R J, Cullen R, et al. New methodology for the ecological footprint with an application to the New Zealand economy [J]. Ecological Economics, 1998, 27(2): 149-160. [Google Scholar]
- Cerutti A K, Bagliani M, Beccaro G L, et al. Application of ecological footprint analysis on nectarine production: Methodological issues and results from a case study in Italy [J]. Journal of Cleaner Production, 2010, 18: 771-776. [Google Scholar]
- Frey S D, Harrison D J, Billett E H. Ecological footprint analysis applied to mobile phones [J]. Journal of Industrial Ecology, 2006, 10(1-2): 199-216. [Google Scholar]
- Herva M, Franco A, Ferreiro S, et al. An approach for the application of the ecological footprint as environmental indicator in the textile sector [J]. Journal of Hazardous Materials, 2008, 156(1): 478-487. [CrossRef] [PubMed] [Google Scholar]
- Herva M, Álvarez A, Roca E. Sustainable and safe design of footwear integrating ecological footprint and risk criteria [J]. Journal of Hazardous Materials, 2011, 192: 1876-1881. [CrossRef] [PubMed] [Google Scholar]
- Herva M, García-Diéguez C, Franco-Uría A, et al. New insights on ecological footprinting as environmental indicator for production processes [J]. Ecological Indicators, 2012, 16: 84-90. [CrossRef] [Google Scholar]
- Herva M, Franco-Uría A, Carrasco E F, et al. Application of fuzzy logic for the integration of environmental criteria in eco-design [J]. Expert Systems with Applications, 2012, 39: 4427-4431. [NASA ADS] [CrossRef] [Google Scholar]
- Lenzen M, Lundie S, Bransgrove G, et al. Assessing the ecological footprint of a large metropolitan water supplier: Lessons for water management and planning towards sustainability [J]. Journal of Environmental Planning and Management, 2003, 46(1): 113-141. [CrossRef] [Google Scholar]
- Limnios E A M, Ghadouani A, Schilizzi S G M, et al. Giving the consumer the choice: A methodology for product ecological footprint calculation [J]. Ecological Economics, 2009, 68: 2525-2534. [Google Scholar]
- Niccolucci V, Galli A, Kitzes J, et al. Ecological footprint analysis applied to the production of two Italian wines [J]. Agriculture Ecosystems and Environment, 2008, 128(3): 162-166. [Google Scholar]
- Saravia-Cortez A M, Herva M, García-Diéguez C, et al. Assessing environmental sustainability of particleboard production process by ecological footprint [J]. Journal of Cleaner Production, 2013, 52: 301-308. [Google Scholar]
- Kitzes J, Wackernagel M. Answers to common questions in ecological footprint accounting [J]. Ecological Indicators, 2009, 9(4): 812-817. [CrossRef] [Google Scholar]
- World Wide Fund for Nature. Living Planet Report 2010 [EB/OL]. [2021-06-16] http://assets.panda.org/downloads/lpr2010.pdf. [Google Scholar]
- Solís-Guzmán J, Marrero M, Ramírez-de-Arellano A. Methodology for determining the ecological footprint of the construction of residential buildings in Andalusia (Spain) [J]. Ecological Indicators, 2013, 25: 239-249. [CrossRef] [Google Scholar]
- Lan S F, Qin P, Lu S F. Ecological Economic System Emergy Analysis [M]. Beijing: Chemical Industry Press, 2002(Ch). [Google Scholar]
- Department of Energy Statistics, National Bureau of Statistics. China Energy Statistical Yearbook [M]. Beijing: China Statistics Press, 1989(Ch). [Google Scholar]
- Department of Energy Statistics, National Bureau of Statistics. China Energy Statistical Yearbook [M]. Beijing: China Statistics Press, 1996(Ch). [Google Scholar]
- Department of Energy Statistics, National Bureau of Statistics. China Energy Statistical Yearbook [M]. Beijing: China Statistics Press, 2014(Ch). [Google Scholar]
- National Bureau of Statistics of China. China Statistical Yearbook [M]. Beijing: China Statistics Press, 1984(Ch). [Google Scholar]
- National Bureau of Statistics of China. China Statistical Yearbook [M]. Beijing: China Statistics Press, 2001(Ch). [Google Scholar]
- National Bureau of Statistics of China. China Statistical Yearbook [M]. Beijing: China Statistics Press, 2004(Ch). [Google Scholar]
- National Bureau of Statistics of China. China Statistical Yearbook [M]. Beijing: China Statistics Press, 2015(Ch). [Google Scholar]
- Zhu Z M. Sawmilling and Lumber Inspection Technology [M]. Beijing: China Forestry Press, 2007: 116-120. [Google Scholar]
- Yin Z H, Tian M H. Analysis of gains or losses of chinese timber imports in great quantities [J]. Forestry Economics, 2006(9): 47-50(Ch). [Google Scholar]
- González-Vallejo P, Marrero M, Solís-Guzmán J. The ecological footprint of dwelling construction in Spain [J]. Ecological Indicators, 2015, 52: 75-84. [CrossRef] [Google Scholar]
- Xia H P. Measurement and Analysis of the Ecological Footprint in the Chinese International Trade [D]. Hangzhou: Zhejiang University, 2012(Ch). [Google Scholar]
- Xie G D, Cao S Y, Yang Q S, et al. Living Planet Report China 2015 [EB/OL]. [2021-05-14]. http://www.docin.com/p-1535085428.html. [Google Scholar]
- Li J Q, Tian K, Chen S Z. Change of Beijing’s ecological footprint and its countermeasure in the New Century [J]. Forestry Economics, 2013 (4): 102-109(Ch). [Google Scholar]
- Gaussin M, Hu G, Abolghasem S, et al. Assessing the environmental footprint of manufactured products: A survey of current literature [J]. International Journal of Production Economics, 2013, 146(2): 515-523. [Google Scholar]
- Westkämper E, Alting L, Arndt G. Life cycle management and assessment: Approaches and visions towards sustainable manufacturing [J]. CIRP Annals, 2000, 49(2): 501-526. [CrossRef] [Google Scholar]
- Joshi K, Venkatachalam A, Jawahir I S. A new methodology for transforming 3R concept into 6R concept for improved product sustainability [C]// IV Global Conference on Sustainable Product Development and Life Cycle Engineering. 2006: 3-6. [Google Scholar]
- Cerutti A K, Beccaro G L, Bagliani M, et al. Multifunctional ecological footprint analysis for assessing eco-efficiency: A case study of fruit production systems in Northern Italy [J]. Journal of Cleaner Production, 2013, 40: 108-117. [CrossRef] [Google Scholar]
All Tables
All Figures
|
Fig. 1 Diagram of the sofa manufacturing process |
| In the text | |
|
Fig. 2 The componential EF of the sofa factory |
| In the text | |
|
Fig. 3 The componential EF of the wooden raw materials |
| In the text | |
|
Fig. 4 The componential EF of the non-wooden raw materials |
| In the text | |
|
Fig. 5 Percent contributions of different components to the total EF of sofa production |
| In the text | |
Current usage metrics show cumulative count of Article Views (full-text article views including HTML views, PDF and ePub downloads, according to the available data) and Abstracts Views on Vision4Press platform.
Data correspond to usage on the plateform after 2015. The current usage metrics is available 48-96 hours after online publication and is updated daily on week days.
Initial download of the metrics may take a while.