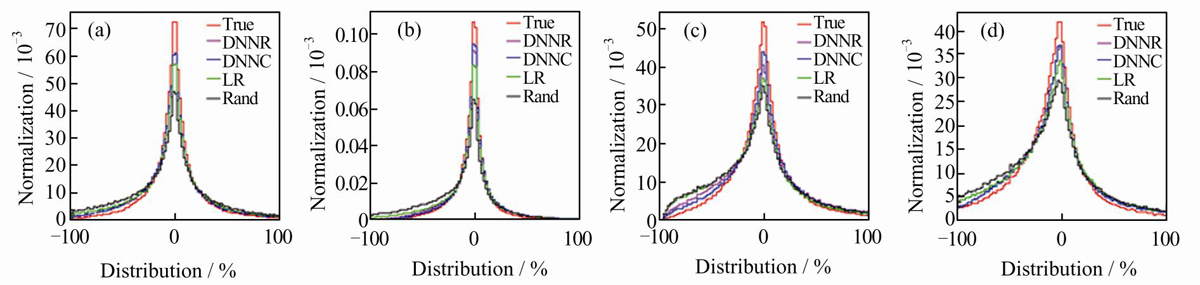
Fig. 7
Comparison of distribution ![]()
Download original image
(a)![]() , (b)
, (b)![]() , (c)
, (c)![]() and (d)
and (d) ![]() . True: the q
2 obtained by true momentum of decayed parent particle to select the better solution, this result is upper threshold in this research; Rand: the q
2 obtained by random strategy to select better solution; DNNC: q
2 obtained by trained DNNC model to select the better solution; DNNR (LR): q
2 obtained by the predicted momentum (P
pred) predicted by DNNR (LR) to select the better solution
. True: the q
2 obtained by true momentum of decayed parent particle to select the better solution, this result is upper threshold in this research; Rand: the q
2 obtained by random strategy to select better solution; DNNC: q
2 obtained by trained DNNC model to select the better solution; DNNR (LR): q
2 obtained by the predicted momentum (P
pred) predicted by DNNR (LR) to select the better solution
Current usage metrics show cumulative count of Article Views (full-text article views including HTML views, PDF and ePub downloads, according to the available data) and Abstracts Views on Vision4Press platform.
Data correspond to usage on the plateform after 2015. The current usage metrics is available 48-96 hours after online publication and is updated daily on week days.
Initial download of the metrics may take a while.