Fig. 2
Download original image
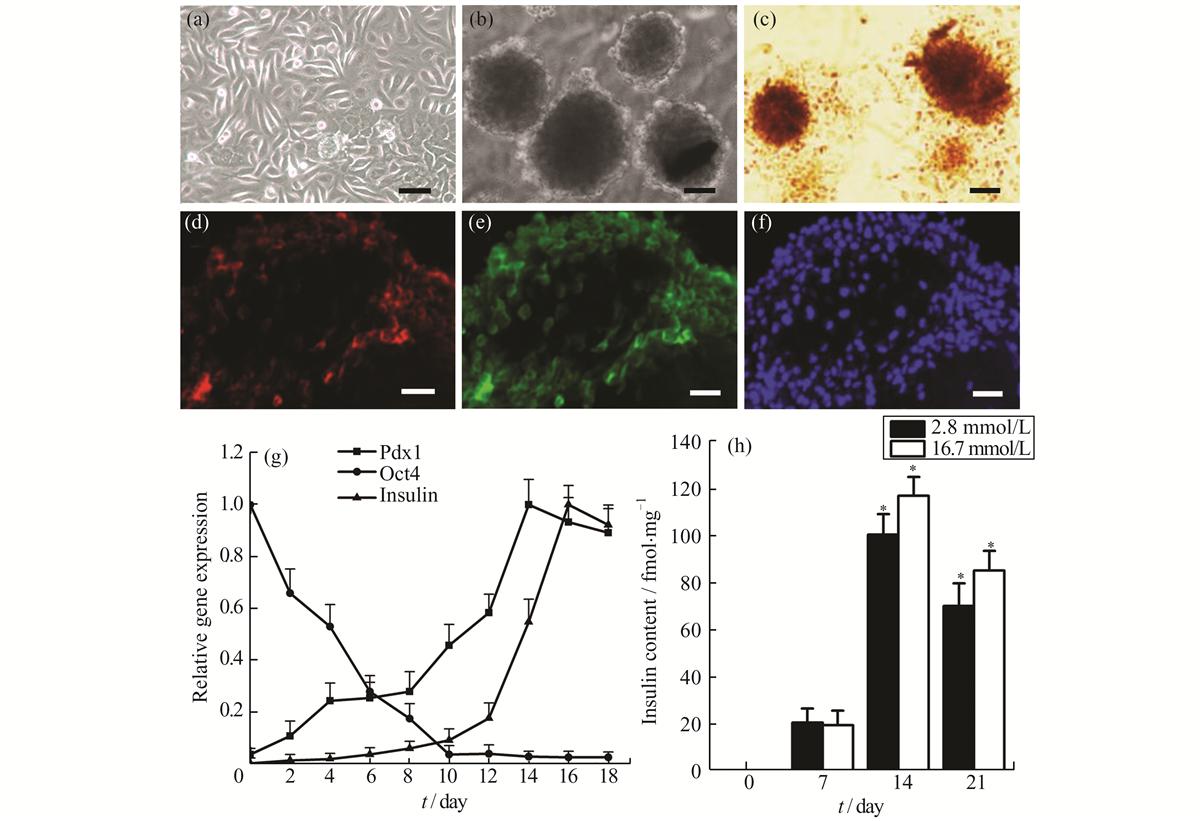
Differentiation of HUMSCs into IPCs Light micrograph of HUMSCs before (a) or after 14 days (b) of the induction. The induced cells could be stained by DTZ (c) and expressions of C-peptide (d) and PP (e) were positive by immunofluorescence staining. The nuclei were counterstained using Hoechst 33342 (f). Pdx1, Oct4 and Insulin expressions were determined during the induction by real-time PCR and the maximum of gene expression was set as 1 (g). The insulin release at low (2.8 mmol/L) and high (16.7 mmol/L) levels of glucose challenge was made in HUMSCs (0 day) and after 7, 14 and 21 days of the induction (h). *P<0.05 vs. 7 days. Scale bar: 50 μm
Current usage metrics show cumulative count of Article Views (full-text article views including HTML views, PDF and ePub downloads, according to the available data) and Abstracts Views on Vision4Press platform.
Data correspond to usage on the plateform after 2015. The current usage metrics is available 48-96 hours after online publication and is updated daily on week days.
Initial download of the metrics may take a while.