| Issue |
Wuhan Univ. J. Nat. Sci.
Volume 28, Number 2, April 2023
|
|
|---|---|---|
| Page(s) | 177 - 184 | |
| DOI | https://doi.org/10.1051/wujns/2023282177 | |
| Published online | 23 May 2023 | |
Biomedicine
CLC number: Q 28
Role of miR-128/216a Regulating Isl1 Expression during Differentiation of Human Umbilical Cord Mesenchymal Stem Cells into Insulin-Producing Cells
1
Clinical Laboratory of the First Affiliated Hospital, Jinzhou Medical University, Jinzhou 121001, Liaoning, China
2
Medical Treatment College, Jinzhou Medical University, Jinzhou 121013, Liaoning, China
3
Nephrology of Jinzhou Central Hospital, Jinzhou 121001, Liaoning, China
† To whom correspondence should be addressed. E-mail: This email address is being protected from spambots. You need JavaScript enabled to view it.
Received:
20
September
2022
Abstract
Islet-1 (Isl1), a LIM homeodomain protein, is expressed in the embryonic pancreatic epithelium. As a key transcription factor, Isl1 can not only regulate insulin gene expression in normal glucose condition but also maintain β-cell function and impact pancreatic β-cell target genes. Some experiments have suggested that MicroRNA (miRNA) can play a critical role during the induction of insulin-producing cells (IPCs). However, it is unclear whether miRNA may regulate Isl1 expression during differentiation of human umbilical cord mesenchymal stem cells (HUMSCs) into IPCs. In this investigation, we induced HUMSCs into IPCs with a modified two-step protocol, activin A, retinoic acid (step1) and conophylline, nicotinamide (step2). To find the miRNA regulating Isl1 expression, we respectively used TargetScan, miRDB and RNAhybrid to predict and got the result, miR-128 and miR-216a. The miRNAs can inhibit Isl1 expression by dual luciferase assay. The results of real-time Polymerase Chain Reaction (PCR) showed that Isl1 expression level was almost reciprocal to that of miR-128 and miR-216a during differentiation of HUMSCs into IPCs. Furthermore, over-expression of miR-128 or miR-216a down-regulated expression levels of Isl1 and MafA. Therefore, miR-128 or miR-216a may regulate expression of islet-specific transcription factors to control differentiation of HUMSCs into IPCs.
Key words: microRNA (miRNA) / Isl1 / human umbilical cord mesenchymal stem cells (HUMSCs) / insulin-producing cells (IPCs)
Biography: MU Tianchi, male, Master candidate, research direction: bases and clinics of stem cells. E-mail: This email address is being protected from spambots. You need JavaScript enabled to view it.
Fundation item: Supported by Liaoning Province Education Administration Funded Program of China (LJKZ1374)
© Wuhan University 2023
 This is an Open Access article distributed under the terms of the Creative Commons Attribution License (https://creativecommons.org/licenses/by/4.0), which permits unrestricted use, distribution, and reproduction in any medium, provided the original work is properly cited.
0 Introduction
In patients with type 1 diabetes mellitus, the autoimmune destruction of β cells results in hyperglycemia and metabolic disorders[1]. Replacing β cells would be a reliable approach for the therapeutic problem and the generation of insulin-producing cells (IPCs) from mesenchymal stromal cells (MSCs) is one of the most attractive interests[2]. MSCs are ideal donor cells for cell transplantation due to the strong immunoregulatory effect[3]. MSCs derived from Wharton's jelly of human umbilical cord (HUMSCs) have critical advantages over MSCs from bone marrow, owing to non-invasion and better accessibility[4,5].
Islet-1 (Isl1), an LIM homeodomain protein, is expressed in the embryonic pancreatic epithelium and maintained in all postnatal islet endocrine cells[6]. During late stages of islet development, the Isl1-deficient mice developed postnatal diabetes due to increased apoptosis of endocrine cells[7]. Furthermore, Isl1 is required for the maturation, proliferation and survival of the endocrine pancreas[8, 9]. As a key transcription factor, Isl1 can not only regulate insulin gene expression in normal glucose condition[10], but also maintain β-cell function and impact pancreatic β-cell target genes[11,12].
MicroRNA (miRNA) can regulate gene expression post-transcriptionally by complementary with target mRNA[13,14]. It is unclear whether miRNA may regulate Isl1 expression during differentiation of HUMSCs into IPCs. Here we respectively used TargetScan, miRDB and RNAhybrid to predict the miRNA targeting Isl1 3′UTR and identified by dual luciferase assay. Expressions of the miRNA and Isl1 mRNA were determined during differentiation of HUMSCs into IPCs and effects after over-expression or down-regulation of the miRNA were detected.
1 Materials and Methods
1.1 Culture and Differentiation of HUMSCs
HUMSCs were purchased from Cyagen Co., LTD. They were cultured in DMEM containing 10% FBS (HyClone). To induce into IPCs, the cells of third to fifth passages were cultured in DMEM/F12 with 2 nmol/L activin A (Sigma) and 2 μmol/L retinoic acid (Sigma) for 6 days. The cells were further cultured and supplemented with 10 mmol/L nicotinamide (Sigma) and 0.1 μg/mL conophylline (BioBioPha).
1.2 Flow Cytometry Analysis
Flow cytometry was used to determine surface antigen expression of HUMSCs. The cells were detached using 0.25% trypsin (Gibco) and then labeled with the following monoclonal antibodies: CD19-FITC, CD44-PE, CD105-PE and CD34-FITC (Biolegend). Labeled cells were analyzed on a FACSCalibur (Becton-Dickinson).
1.3 Dithizone (DTZ) Staining
Stock solution was prepared with 10 mg DTZ (dithizone, Sigma) in 1 mL DMSO (dimethyl sulfoxide). Staining solution was made by adding 30 μL stock solution to 3 mL PBS and after 14 days of the induction, and the cells were incubated in DTZ staining solution for 10 min. After rinsing three times with PBS, the cells were examined with phase contrast microscope (Olympus).
1.4 Immunocytofluorescence
After 14 days of the induction the cells were fixed with ice-cold methanol for 8 min and permeabilized with 0.05% Triton X-100 (Sigma) for 5 min. After blocking with 5% normal horse serum dissolved in PBS for 1 h, the cells were incubated overnight with anti-C-peptide antibody (1:200, Santa Cruz) and anti-PP antibody (PP: pancreatic polypeptide, 1:200, Santa Cruz) at 4 ℃. The cells were further incubated with FITC or Texas Red-conjugated anti-rabbit IgG (1:1 000, Sigma-Aldrich) for 1 h. Followed by washing, nuclei were counterstained using Hoechst 33342 and the samples were examined with a fluorescence microscope (Olympus).
1.5 Insulin Secretion Assay
After 14 days of the induction the cells were washed three times with Krebs Ringer bicarbonate (KRB) buffer and pre-incubated for 1 h in KRB buffer. The cells were then incubated in KRB buffer containing 2.8 (low) or 16.7 (high) mmol/L glucose for 1 h at 37 ℃. The medium was collected and stored at -20 ℃. Insulin levels were measured with Human Insulin ELISA Kit (Millipore) and the data were normalized to total protein. The insulin secretion assay was previously reported by Wei et al[15].
1.6 Prediction of miRNA
The binding site between Isl1 mRNA and miRNA was respectively predicted with TargetScan (http://www.targetscan.org/), RNAhybrid (https://bibiserv.cebitec.uni-bielefeld.de /rnahybrid) and miRDB (http://mirdb.org/cgi-bin/search.cgi).
1.7 Dual Luciferase Assay
The binding site of Isl1 mRNA was cloned by Polymerase Chain Reaction (PCR) and inserted between the Sac I and Xba I restriction sites of pmirGLO vector (Promega) for construction of the luciferase reporter vector according to the method of Mu et al[16]. The oligonucleotides of wildtype version (wt) were 5'-CCGAGCTCCC TGTTGGAGAAAGTGGG-3'(sense) and 5'-GCTCTAG ATTTGCGTTTTGTTTGTTG-3' (anti-sense). A mutated version (5'-GUGAUAUGGUAGCAAUCACACUAA-3', mut) was constructed with QuickChange Site-Directed Mutagenesis Kit (Stratagene) according to Xue et al[17]. 293T cells were seeded into 12-well plates and transfected with 200 ng of empty reporter (vehicle), pmirGLO-Isl1-wt or pmirGLO-Isl1-mut using Lipofectamine 2000 (Invitrogen) and then cotransfected with 20 nmol/L of control mimic duplexes, miR-128 or miR-216a mimic and miR-128 or miR-216a inhibitor (Dharmacon) according to Bai et al[18]. The cells were assayed for Firefly luciferase activity and Renilla reniformis luciferase activity using the Dual-Luciferase Assay System (Promega).
1.8 Real-Time PCR
Total RNAs and miRNAs were isolated and reverse transcription was carried out with PrimeScript™ RT reagent Kit with gDNA Eraser (TaKaRa). Quantitative PCR was done with One Step TB Green® PrimeScript™ RT-PCR Kit (TaKaRa) and the data were normalized to Gapdh. Primers were listed in Table 1 and the reverse primers of miRNA were universal.
Primer sequence of real-time PCR
1.9 SDS-PAGE and Western Blot
HUMSCs were transfected with 20 nmol/L of control mimic duplexes, miR-128 or miR-216a mimic and miR-128 or miR-216a inhibitor and cultured with 10 mmol/L nicotinamide and 0.1 μg/mL conophylline for 2 days. The cells were harvested and lysed in a lysis buffer. The lysates containing 15 μg of protein were heated for 5 min in SDS sample buffer and separated by electrophoresis on 10% polyacrylamide gel, and then transferred to supported nitrocellulose membrane (Bio-Rad). Membranes were blocked for 1 h and incubated with anti-Isl1 (1:100, Santa Cruz) and anti-MafA (1:200, Santa Cruz) overnight at 4 ℃. The blots were incubated with horseradish conjugated secondary antibodies and detected with enhanced chemiluminiscence reagents, and then visualized.
1.10 Statistical Analysis
All experiments were performed at least three times. Data are presented as mean±SEM. Statistical analysis was performed using one-way ANOVA. Significant difference was considered if P<0.05.
2 Results
2.1 Characterization of HUMSCs
Flow Cytometer (FCM) analysis of HUMSCs showed the cells lacked expressions of CD19 (0.11%), CD34 (0.15%) and they positively expressed CD44 (99.37%), CD105 (99.28%). CD19 and CD34 represented two of hematopoietic markers, whereas CD44 and CD105 were markers of MSCs (Fig. 1).
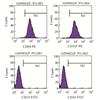 |
Fig. 1 Characterization of HUMSCs HUMSCs were harvested and labeled with antibodies against CD19, CD34, CD44 and CD105 and then analyzed by flow cytometry |
2.2 Differentiation of HUMSCs into IPCs
HUMSCs were cultured and induced to differentiate into IPCs. Under a phase contrast microscope, HUMSCs displayed a uniform pattern with a typical short spindle shaped morphology (Fig. 2(a)). After 14 days of the induction, the cells gathered into clusters (Fig. 2(b)) stained scarlet by DTZ (Fig. 2(c)) and expressions of C-peptide (Fig. 2(d)) and PP (Fig. 2(e)) could be detected by immunofluorescence staining. The nuclei were counterstained using Hoechst 33342 (Fig. 2(f)).
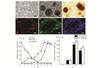 |
Fig. 2 Differentiation of HUMSCs into IPCs Light micrograph of HUMSCs before (a) or after 14 days (b) of the induction. The induced cells could be stained by DTZ (c) and expressions of C-peptide (d) and PP (e) were positive by immunofluorescence staining. The nuclei were counterstained using Hoechst 33342 (f). Pdx1, Oct4 and Insulin expressions were determined during the induction by real-time PCR and the maximum of gene expression was set as 1 (g). The insulin release at low (2.8 mmol/L) and high (16.7 mmol/L) levels of glucose challenge was made in HUMSCs (0 day) and after 7, 14 and 21 days of the induction (h). *P<0.05 vs. 7 days. Scale bar: 50 μm |
The expressions of Pdx1, Oct4 and Insulin were determined by real-time PCR during the induction. If the maximum of gene expression was set as 1, Pdx1 expression level after 4 days of the induction was (0.241±0.069) and increased to (0.456±0.081) after 10 days and reached the maximum after 14 days. Insulin expression level after 4 days of the induction was (0.017±0.022) and increased slowly to (0.089±0.044) after 10 days and reached the maximum after 16 days. On the contray, Oct4 expression level in HUMSCs (0 d) was the maximum and decreased rapidly to (0.035±0.033) after 10 days and decreased slowly afterwards (Fig. 2(g)).
The glucose-stimulated insulin release was also made during the induction. After 14 days of the induction, there was a significant increase of insulin release at low (100.68±8.71, P<0.05) and high (117.24±8.06, P<0.05) levels of glucose challenge compared with that (20.45±5.96; 19.33±6.12) after 7 days, respectively. After 21 days the insulin content was declined and still 70.17±9.62 (P<0.05) and 85.32±8.43 (P<0.05) as compared with that after 7 days, respectively. But there was no statistical significance of insulin release between low and high levels of glucose challenge (Fig. 2(h)).
2.3 Prediction of miRNA Targeting Isl1 3' UTR
To find the miRNA targeting Isl1 (GI: 115387113), we respectively used TargetScan, miRDB and RNAhybrid to predict and got the results, miR-128 and miR-216a. TargetScan showed that the target sites of two miRNAs were the same and conserved from position 170 to 177 of Isl1 3' UTR. The seed match of miR-128 and miR-216a was 8mer and both context+ score percentiles were 99 (Fig. 3(a)). The target sites (CACTGTG) of two miRNAs on Isl1 3' UTR were also the same and the seed location was 170 and the target score was 78 shown by miRDB (Fig. 3(b)). RNAhybrid showed the "seed"(GUGACAC) of two miRNAs was the same and the minimum free energy (MFE) was -24.1 kcal/mol and -20.8 kcal/mol (1 kcal=4.2 kJ), respectively (Fig. 3(c)). All of these indicated two miRNAs were well complementary with their target site.
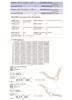 |
Fig. 3 Prediction of miRNAs targeting Isl1 3' UTR TargetScan showed the target site of miR-128 and miR-216a was the same and conserved from position 170 to 177 (a); The target sites (CACTGTG) of two miRNAs on Isl1 3' UTR were also the same and the seed location was 170 and the target score was 78 shown by miRDB (b). RNAhybrid showed the "seed"(GUGACAC) of two miRNAs was the same and the MFE was -24.1 kcal/mol and -20.8 kcal/mol, respectively (c); 1 kcal=4.2 kJ |
2.4 Identification of miR-128 or/and miR-216a Regulating Isl1 Expression
If luciferase activity from pmirGLO (vehicle) was defined as 1 in control group, luciferase activity from pmirGLO-Isl1-wt (wt) was suppressed by miR-128 or miR-216a mimic. Instead, miR-128 or miR-216a mimic did not affect luciferase activity from pmirGLO-Isl1-mut (mut). However, luciferase activity from "wt" was increased by miR-128 or miR-216a inhibitor and miR-128 or miR-216a inhibitor did not affect luciferase activity from "mut" (Fig. 4(a)). This illustrated that miR-128 and miR-216a could inhibit Isl1 expression.
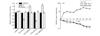 |
Fig. 4 Identification of miR-128 or/and miR-216a regulating Isl1 expression (a) Relative luciferase activity cotransfected with empty reporter (vehicle), pmirGLO-Isl1-wt (wt) or pmirGLO-Isl1-mut (mut), and control mimic duplexes (control), miR-128 or miR-216a mimic and miR-128 or miR-216a inhibitor; Relative luciferase activity from vehicle in control group was defined as 1, *P<0.05; (b) Real-time PCR analysis of miR-128, miR-216a and Isl1 mRNA expression levels during the induction; Gene expression in HUMSCs (0 day) was defined as 1 and the y-axis represented relative expression level compared with expression in HUMSCs |
In further, real-time PCR was employed to measure miR-128, miR-216a and Isl1 mRNA expression levels during differentiation of HUMSCs into IPCs. If gene expression in HUMSCs was defined as 1, Isl1 mRNA expression level after 4 days of the induction was higher than that in HUMSCs and increased to (30.79±6.97) fold after 14 days, but then declined and still (21.89±7.04) fold after 18 days. On the contray, expression of miR-128 after 4 days was lower than that in HUMSCs and decreased to (0.173±0.027) fold after 18 days. Similarly, expression of miR-216a after 4 days was (0.517±0.072) fold as compared with that in HUMSCs and decreased to (0.136±0.037) after 18 days (Fig. 4(b)). The result corresponded to that of dual luciferase assay.
2.5 Effect of miR-128 and miR-216a on the Differentiation of HUMSCs
Real-time PCR was employed to measure the expression level of miR-128 or miR-216a after transfection with its mimic or inhibitor. The expression of miR-128 (13.46±1.07) or miR-216a (15.72±0.95) was higher in the mimic group than that in control group, while the expression of miR-128 or miR-216a was (0.21±0.02; 0.18±0.02) fold lower in the inhibitor group than that in control group, respectively (Fig. 5(a)).
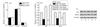 |
Fig. 5 Effect of miR-128 and miR-216a on the differentiation of HUMSCs (a) Real-time PCR analysis of miR-128 or miR-216a expression level after transfection with miRNA mimic or inhibitor; The miRNA expression level in the control group was set as 1, *P<0.05 vs the control group; Isl1 and MafA expression levels were determined after transfection with miRNA mimic or inhibitor by real-time PCR (b) and western blot (c). The expression level in the control group was respectively set as 1, *P<0.05 vs. the control group; In (c), a: control, b: miR-128 mimic, c: miR-128 inhibitor, d: miR-216a mimic, e: miR-216a inhibitor |
The expression of target gene Isl1 and one of β-cell-specific transcription factors MafA were analyzed to explore effect of miR-128 and miR-216a on differentiation of HUMSCs into IPCs. Isl1 mRNA expression level in miR-128 or miR-216a mimic group was (0.465±0.061; 0.371±0.052) fold lower than that in control group. Similarly, MafA expression decreased to (0.539±0.048; 0.543±0.064) in miR-128 or miR-216a mimic group. However, Isl1 mRNA expression level in miR-128 or miR-216a inhibitor group was (1.468±0.064; 1.589±0.077) fold higher than that in control group. MafA mRNA expression level was (1.037±0.045; 0.973±0.069) in miR-128 or miR-216a inhibitor group, while there was no difference between the inhibitor group and the control group (Fig. 5(b)). The protein level in miR-128 or miR-216a mimic group was significantly decreased compared with the control group (Fig. 5(c)).
3 Discussion
Here we cultured HUMSCs in vitro and found the cells lacked expression of the hematopoietic markers and positively expressed two of the major markers characteristic of MSCs. The cells of third to fifth passages were induced into IPCs with a modified two-step protocol, activin A, retinoic acid (step1) and conophylline, nicotinamide (step2). Previously, we developed an one-step method with activin A, conophylline and nicotinamide to induce mouse bMSCs into IPCs[17]. In this study, after 14 days of induction the cells gathered into clusters and expressions of C-peptide and PP could be detected by immunofluorescence staining. The mRNA of Isl1, Pdx1 and Insulin had characteristics of temporal expression and there was a significant increase of insulin release at different levels of glucose challenge during the induction. But there was no statistical significance of insulin release between low and high levels of glucose challenge, so the IPCs were immature.
Some miRNAs played a critical role during the induction of IPCs[15-18]. Recently, Sebastiani et al[19] observed 18 miRNAs differentially expressed (11 were upregulated and 7 downregulated) during the induction of human induced pluripotent stem cells into IPCs and demonstrated that differentially expressed miRNAs target several genes involved in pancreas organogenesis. In our study, we respectively used TargetScan, miRDB and RNAhybrid to predict miRNA targeting Isl1 and got the results, miR-128 and miR-216a. The result of dual luciferase assay illustrated that miR-128 and miR-216a could inhibit Isl1 expression by binding to its 3′UTR and further identified by real-time PCR. Isl1 expression level was rapidly risen after 8 days of the induction and increased to the maximum after 14 days. On the contrary, expression levels of miR-128 and miR-216a were rapidly decreased after 8 days and declined to the minimum after 14 days. The result showed that Isl1 expression level was almost reciprocal to that of miR-128 and miR-216a and this corresponded to that of dual luciferase assay.
To explore roles of miR-128 and miR-216a on differentiation of HUMSCs into IPCs, we compared expression levels of Isl1 and MafA using real-time PCR and western blot. After transfection with miRNA mimic, Isl1 and MafA mRNA expression levels were significantly decreased. Instead, Isl1 mRNA expression level in miRNA inhibitor group was higher than that in control group, while there was no difference in MafA mRNA expression level between the inhibitor group and the control group. Similar changes of protein level were shown by western blot and this also corresponded to that of dual luciferase assay. This indicated that MafA was not the target gene of miR-128 or miR-216a and its expression level could be decreased as Isl1 expression level was significantly decreased because MafA was the downstream gene of Isl1. So miR-128 or miR-216a may regulate expression of islet-specific transcription factors to control the differentiation of HUMSCs.
4 Conclusion
In this investigation, we induced HUMSCs into IPCs with a modified two-step protocol. To find the miRNA regulating Isl1 expression, we respectively used TargetScan, miRDB and RNAhybrid to predict and get the results, miR-128 and miR-216a. The miRNAs can inhibit Isl1 expression by dual luciferase assay. The results of real-time PCR showed that Isl1 expression level was almost reciprocal to that of miR-128 and miR-216a during differentiation of HUMSCs into IPCs. Furthermore, over-expression of miR-128 or miR-216a down-regulated expression levels of Isl1 and MafA. Therefore, miR-128 or miR-216a may regulate expression of islet-specific transcription factors to control differentiation of HUMSCs into IPCs.
References
- Zheng Z H, Wu J Y, Wang R L, et al. Diabetes mellitus may induce cardiovascular disease by decreasing neuroplasticity[J]. Functional Neurology, 2014, 29(1): 7-13. [Google Scholar]
- Karaoz E, Okcu A, Ünal Z S, et al. Adipose tissue-derived mesenchymal stromal cells efficiently differentiate into insulin- producing cells in pancreatic islet microenvironment both in vitro and in vivo [J]. Cytotherapy, 2013, 15(5): 557-570. [CrossRef] [PubMed] [Google Scholar]
- Choudhery M S, Badowski M, Muise A, et al. Comparison of human mesenchymal stem cells derived from adipose and cord tissue [J]. Cytotherapy, 2013, 15(3): 330-343. [CrossRef] [PubMed] [Google Scholar]
- Hsieh J Y, Wang H W, Chang S J, et al. Mesenchymal stem cells from human umbilical cord express preferentially secreted factors related to neuroprotection, neurogenesis, and angiogenesis [J]. PLoS One, 2013, 8(8): e72604. [NASA ADS] [CrossRef] [PubMed] [Google Scholar]
- Zhu S F, Zhong Z N, Fu X F, et al. Comparison of cell proliferation, apoptosis, cellular morphology and ultrastructure between human umbilical cord and placenta-derived mesenchymal stem cells [J]. Neuroscience Letters, 2013, 541: 77-82. [CrossRef] [PubMed] [Google Scholar]
- Ahlgren U, Pfaff S L, Jessell T M, et al. Independent requirement for Isl1 in formation of pancreatic mesenchyme and islet cells[J]. Nature, 1997, 385(6613): 257-260. [NASA ADS] [CrossRef] [PubMed] [Google Scholar]
- Du A P, Hunter C S, Murray J, et al. Islet-1 is required for the maturation, proliferation, and survival of the endocrine pancreas[J]. Diabetes, 2009, 58(9): 2059-2069. [CrossRef] [PubMed] [Google Scholar]
- Liu J X, Hunter C S, Du A P, et al. Islet-1 regulates Arx transcription during pancreatic islet alpha-cell development[J]. The Journal of Biological Chemistry, 2011, 286(17): 15352-15360. [CrossRef] [PubMed] [Google Scholar]
- Ediger B N, Du A P, Liu J X, et al. Islet-1 is essential for pancreatic β-cell function[J]. Diabetes, 2014, 63(12): 4206-4217. [CrossRef] [PubMed] [Google Scholar]
- Wang W P, Shi Q, Guo T, et al. PDX1 and ISL1 differentially coordinate with epigenetic modifications to regulate insulin gene expression in varied glucose concentrations[J]. Molecular and Cellular Endocrinology, 2016, 428: 38-48. [CrossRef] [PubMed] [Google Scholar]
- Galloway J R, Bethea M, Liu Y P, et al. SSBP3 interacts with islet-1 and Ldb1 to impact pancreatic β-cell target genes[J]. Molecular Endocrinology, 2015, 29(12): 1774-1786. [CrossRef] [PubMed] [Google Scholar]
- Shao W J, Szeto V, Song Z L, et al. The LIM homeodomain protein ISL1 mediates the function of TCF7L2 in pancreatic beta cells[J]. Journal of Molecular Endocrinology, 2018, 61(1): 1-12. [Google Scholar]
- Schirle N T, Sheu-Gruttadauria J, MacRae I J. Structural basis for microRNA targeting[J]. Science, 2014, 346(6209): 608-613. [CrossRef] [PubMed] [Google Scholar]
- Chandradoss S D, Schirle N T, Szczepaniak M, et al. A dynamic search process underlies microRNA targeting[J]. Cell, 2015, 162(1): 96-107. [Google Scholar]
- Wei R, Yang J, Liu G Q, et al. Dynamic expression of microRNAs during the differentiation of human embryonic stem cells into insulin-producing cells[J]. Gene, 2013, 518(2): 246-255. [Google Scholar]
- Mu C Z, Wang T, Wang X M, et al. Identification of microRNAs regulating Hlxb9 gene expression during the induction of insulin-producing cells[J]. Cell Biology International, 2016, 40(5): 515-523. [Google Scholar]
- Xue J, Xue J W, Zhang J, et al. MiR-130b-3p/301b-3p negatively regulated Rb1cc1 expression on myogenic differentiation of chicken primary myoblasts[J]. Biotechnology Letters, 2017, 39(11): 1611-1619. [Google Scholar]
- Bai C Y, Gao Y H, Li X C, et al. MicroRNAs can effectively induce formation of insulin-producing cells from mesenchymal stem cells[J]. Journal of Tissue Engineering and Regenerative Medicine, 2017, 11(12): 3457-3468. [CrossRef] [PubMed] [Google Scholar]
- Sebastiani G, Valentini M, Grieco G E, et al. MicroRNA expression profiles of human iPSCs differentiation into insulin-producing cells[J]. Acta Diabetologica, 2017, 54(3): 265-281. □ [Google Scholar]
All Tables
All Figures
|
Fig. 1 Characterization of HUMSCs HUMSCs were harvested and labeled with antibodies against CD19, CD34, CD44 and CD105 and then analyzed by flow cytometry |
| In the text | |
|
Fig. 2 Differentiation of HUMSCs into IPCs Light micrograph of HUMSCs before (a) or after 14 days (b) of the induction. The induced cells could be stained by DTZ (c) and expressions of C-peptide (d) and PP (e) were positive by immunofluorescence staining. The nuclei were counterstained using Hoechst 33342 (f). Pdx1, Oct4 and Insulin expressions were determined during the induction by real-time PCR and the maximum of gene expression was set as 1 (g). The insulin release at low (2.8 mmol/L) and high (16.7 mmol/L) levels of glucose challenge was made in HUMSCs (0 day) and after 7, 14 and 21 days of the induction (h). *P<0.05 vs. 7 days. Scale bar: 50 μm |
| In the text | |
|
Fig. 3 Prediction of miRNAs targeting Isl1 3' UTR TargetScan showed the target site of miR-128 and miR-216a was the same and conserved from position 170 to 177 (a); The target sites (CACTGTG) of two miRNAs on Isl1 3' UTR were also the same and the seed location was 170 and the target score was 78 shown by miRDB (b). RNAhybrid showed the "seed"(GUGACAC) of two miRNAs was the same and the MFE was -24.1 kcal/mol and -20.8 kcal/mol, respectively (c); 1 kcal=4.2 kJ |
| In the text | |
|
Fig. 4 Identification of miR-128 or/and miR-216a regulating Isl1 expression (a) Relative luciferase activity cotransfected with empty reporter (vehicle), pmirGLO-Isl1-wt (wt) or pmirGLO-Isl1-mut (mut), and control mimic duplexes (control), miR-128 or miR-216a mimic and miR-128 or miR-216a inhibitor; Relative luciferase activity from vehicle in control group was defined as 1, *P<0.05; (b) Real-time PCR analysis of miR-128, miR-216a and Isl1 mRNA expression levels during the induction; Gene expression in HUMSCs (0 day) was defined as 1 and the y-axis represented relative expression level compared with expression in HUMSCs |
| In the text | |
|
Fig. 5 Effect of miR-128 and miR-216a on the differentiation of HUMSCs (a) Real-time PCR analysis of miR-128 or miR-216a expression level after transfection with miRNA mimic or inhibitor; The miRNA expression level in the control group was set as 1, *P<0.05 vs the control group; Isl1 and MafA expression levels were determined after transfection with miRNA mimic or inhibitor by real-time PCR (b) and western blot (c). The expression level in the control group was respectively set as 1, *P<0.05 vs. the control group; In (c), a: control, b: miR-128 mimic, c: miR-128 inhibitor, d: miR-216a mimic, e: miR-216a inhibitor |
| In the text | |
Current usage metrics show cumulative count of Article Views (full-text article views including HTML views, PDF and ePub downloads, according to the available data) and Abstracts Views on Vision4Press platform.
Data correspond to usage on the plateform after 2015. The current usage metrics is available 48-96 hours after online publication and is updated daily on week days.
Initial download of the metrics may take a while.