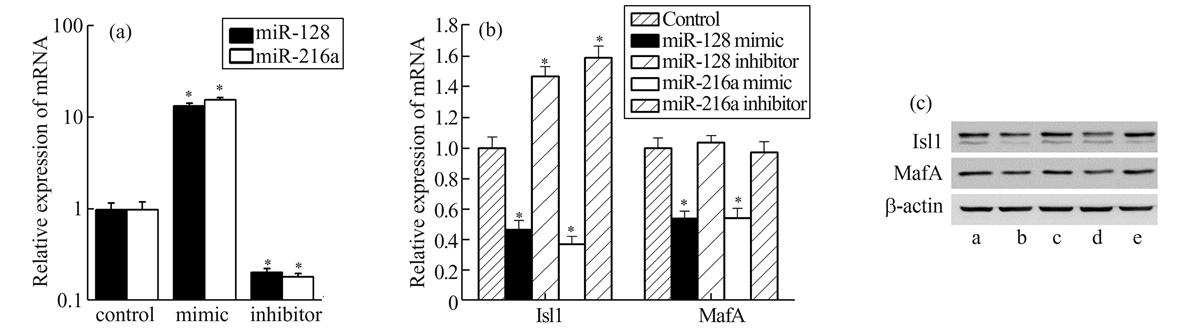
Fig. 5
Download original image
Effect of miR-128 and miR-216a on the differentiation of HUMSCs (a) Real-time PCR analysis of miR-128 or miR-216a expression level after transfection with miRNA mimic or inhibitor; The miRNA expression level in the control group was set as 1, *P<0.05 vs the control group; Isl1 and MafA expression levels were determined after transfection with miRNA mimic or inhibitor by real-time PCR (b) and western blot (c). The expression level in the control group was respectively set as 1, *P<0.05 vs. the control group; In (c), a: control, b: miR-128 mimic, c: miR-128 inhibitor, d: miR-216a mimic, e: miR-216a inhibitor
Current usage metrics show cumulative count of Article Views (full-text article views including HTML views, PDF and ePub downloads, according to the available data) and Abstracts Views on Vision4Press platform.
Data correspond to usage on the plateform after 2015. The current usage metrics is available 48-96 hours after online publication and is updated daily on week days.
Initial download of the metrics may take a while.