| Issue |
Wuhan Univ. J. Nat. Sci.
Volume 28, Number 5, October 2023
|
|
|---|---|---|
| Page(s) | 441 - 450 | |
| DOI | https://doi.org/10.1051/wujns/2023285441 | |
| Published online | 10 November 2023 | |
Information Technology
CLC number: P352.7
Pre-Earthquake Ionospheric Anomalies of the Wenchuan Earthquake Studied with DEMETER Satellite
School of Electronic Information, Wuhan University, Wuhan 430079, Hubei, China
† To whom correspondence should be addressed. E-mail: This email address is being protected from spambots. You need JavaScript enabled to view it.
Received:
17
April
2023
Abstract
The pre-earthquake ionospheric anomalies in Wenchuan, China (21°-41°N, 93°-113°E) are studied and analyzed using the summer nighttime data from 2005 to 2008 measured by DEMETER (Detection of Electro-Magnetic Emission Transmitted from Earthquake Regions) satellite detectors ICE (Internet Communications Engine), IAP (In Application Programming), and ISL (Interior Switching Link). In this paper, we take the 12 May 2008 Wenchuan earthquake as an example, use the spatial gridding method to construct the background field over the epicenter, analyze the background characteristics of very low frequency (VLF) electric field components, low-energy particle parameters, and plasma parameters, and define the perturbation intensity index of each parameter before the earthquake to extract each parameter anomaly in both space and time dimensions. The results show that the background values of some ionospheric parameters in the Wenchuan area are related to spatial distribution. Moreover, anomalous enhancement of low-frequency electric field power spectral density, H+ concentration, He+ concentration and ion concentration with different intensities and anomalous weakening of ion temperature were extracted in the fifteen days before the Wenchuan earthquake. After filtering the data to exclude external interference, such as solar activity, this paper concludes that there is some connection between these anomalies and the Wenchuan earthquake.
Key words: Wenchuan earthquake / pre-earthquake ionospheric anomaly / DEMETER (Detection of Electro-Magnetic Emission Transmitted from Earthquake Regions) satellite
Biography: LU Jingming, male, Master, research direction: ionospheric sounding. E-mail: This email address is being protected from spambots. You need JavaScript enabled to view it.
© Wuhan University 2023
 This is an Open Access article distributed under the terms of the Creative Commons Attribution License (https://creativecommons.org/licenses/by/4.0), which permits unrestricted use, distribution, and reproduction in any medium, provided the original work is properly cited.
0 Introduction
Accurate prediction of earthquakes is still one of the most challenging problems in the world. Since the 20th century, scholars have been studying the relationship between earthquakes and the ionosphere to find new methods to predict earthquakes[1,2]. The statistical analysis results of previous earthquake cases show that earthquakes will cause electromagnetic anomalies or plasma parameters anomalies in the ionosphere over the seismogenic area through various channels[3-5]. The Wenchuan earthquake on 12 May 2008 attracted the attention of many scholars. Liu et al[6] found an unusual increase and decrease of ionospheric TEC over the epicenter before the Wenchuan earthquake. Zhang et al[7] used DEMETER (Detection of Electro-Magnetic Emission Transmitted from Earthquake Regions) satellite data to extract a significant low O+ concentration before the Wenchuan earthquake. He et al[8] confirmed the existence of 5 distinct isoseismic ionospheric disturbances in the Wenchuan earthquake. Yang et al[9] found an anomalous enhancement in the power spectral density of the electric field before the Wenchuan earthquake.
The DEMETER satellite is the world's first satellite dedicated to detecting ionospheric information, and the information related to the Wenchuan earthquake in its recorded data has not been fully explored. This paper extracts the ionospheric anomalies before the Wenchuan earthquake based on the ionospheric parameter data recorded by the DEMETER satellite, mainly from the perspective of very low frequency (VLF) band electric field power spectral density (PSD) recorded by ICE (Internet Communications Engine) payload, H+, He+, O+ concentration and ion temperature (Ti) recorded by IAP (In Application Programming) payload, and electron density (Ne), ion density (Ni), and electron temperature (Te) recorded by ISL(Interior Switching Link) payload. It was found that anomalies in various parameters of the ionosphere occurred in the epicenter within fifteen days before the Wenchuan earthquake, and partially coincided with previous research results.
1 Data Screening and Pre-Processing
In this paper, we use the single-component waveform data of electric field in the VLF band (data number 1 131) from the DEMETER satellite payload ICE, the low-energy particle parameter data (data numbers 1 139 and 1 140) recorded in the survey and burst modes of the payload IAP, and the plasma parameter data (data numbers 1 143 and 1 144) recorded in the survey and burst modes of the payload ISL. The DEMETER satellite orbit types are divided into upper and lower half orbits, which correspond to the night and daytime in local time, respectively. Since the ionosphere is more influenced by solar radiation during the daytime, and the ionospheric parameters have seasonal variations, this paper mainly uses the data obtained by the ICE, IAP, and ISL payloads during the nighttime soundings in the summer of 2005-2008 for the study (according to the geomagnetic season division method, May, June, July, and August are summer months). The data of complex space weather (the disturbance storm time  ) are also excluded according to the geomagnetic index.
For ICE load data, this paper studies PSD in the VLF band and uses the VLF band subdivision rule to divide the band (3 Hz-20 kHz) into four new bands: super low frequency (SLF) band (30-300 Hz), ultra low frequency (ULF) band (330-3 300 Hz), VLF band (4-15 kHz), low frequency (LF) band (15-20 kHz)[9]. For the IAP and ISL load data, to avoid the discontinuity of the same orbit data caused by the two operation modes of the DEMETER satellite, this paper combines the two types of data of the same orbit in the data screening stage to form a complete orbit data, which can better extract the pre-earthquake anomaly.
2 Research Methodology
According to the existing coupled seismic-ionospheric models, the ionospheric anomalies caused by earthquakes are often offset relative to the epicenter position, so a specific range of study area is needed to extract the ionospheric anomalies, and the pregnant zone of earthquakes is chosen as the study area in this paper, and the size of the pregnant zone can be estimated according to equation (1)[10-12].
 (1)
(1)
where R (unit: km) is the diameter of the pregnant seismic zone, and M is the earthquake magnitude.
Firstly, the ionospheric background field of the Wenchuan region is constructed. In this paper, Wenchuan (latitude: 31.0°N, longitude: 103.4°E) is taken as the center, and the study area is selected as (21°-41°N, 93°-113°E), and the area is spatially gridded into 400 small grids of  . The nighttime data of May, June, July, and August from 2005 to 2007 were selected as the background data and assigned to each small grid according to the latitude and longitude, and the mean and standard deviation of each grid were found, then we were able to construct the
  mean matrix
  and standard deviation matrix
  , respectively. Then the data of fifteen days before and the day of the earthquake were selected as the observed data, and the mean of the observed data was obtained according to the construction process of the background field matrix
  . Define the disturbance amplitude extraction equation:
 (2)
(2)
where  is a dimensionless indicator. This process is called normalization. The value of
  in equation (2) is used to measure the perturbation of the observed data relative to the background data. When the value of
  exceeds 3, i.e., the observed data deviates from the background data by more than 3 times the standard deviation, according to the 3
 criterion of statistics, this paper considers that there is an anomaly in the observed data.
In order to better analyze the correlation between the extracted anomalies and the earthquakes, this paper will draw the daily mean variation curves of the observed data in the anomaly area after observing the anomalies based on the spatial dimension, and then observe the anomalies from the temporal dimension, which will make the anomaly results more comprehensive and reliable.
3 Analysis Results and Discussion
3.1 Analysis of Ionospheric Background in Wenchuan Region
As shown in Fig. 1, the mean background value of each ionospheric parameter in the Wenchuan area is plotted, from which it can be seen that the logarithm values of PSD (unit:  ) in the SLF, ULF, and VLF bands are almost all distributed in the interval of
  to 1, and the distribution of PSD values in the overall region is relatively uniform, without prominent characteristics of changing with longitude and latitude; the logarithm values of PSD in the LF band are almost all greater than 1, and the logarithm value of LF band PSD in high longitude region is more than 2, and the spatial distribution of LF band PSD has a tendency to increase with longitude in mid-latitude regions. And the spatial distributions of O+ concentration, Ne and Ni are relatively uniform, with O+ concentration around
  , Ne around 18 000 cm-1 and Ni around 60 000 cm-1. H+ concentration, He+ concentration, Ti, and Te have a clear trend of increasing dimensionality.
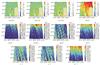 |
Fig. 1 Background mean plot for each parameter The horizontal axis is longitude, and the vertical axis is latitude |
3.2 Analysis of Disturbance Characteristics during the No-Earthquake Period
To have a more comprehensive and objective understanding of the pre-earthquake anomalies of the ionospheric parameters, this paper selects the date data under the no-earthquake condition with calm space weather as the data during the no-earthquake period, and normalizes them to extract the magnitude of the perturbation of each parameter with respect to the background field. The normalization results of the ionospheric data in the Wenchuan area in 2005 are shown below. Figures 2-4 show the normalization results of each parameter in the loading ICE, IAP, and ISL, respectively. and it can be seen that the values of the perturbation intensity index  of each parameter relative to the background data during the no-earthquake period are mainly in the range of 0-1, and some regions reach 2, but none of the anomalies exceed 3.
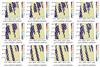 |
Fig. 2 Normalized results for the four parameters on ICE load without earthquakes in 2005 The horizontal axis is longitude, and the vertical axis is latitude |
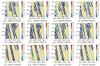 |
Fig. 3 Normalized results for the four parameters on IAP load without earthquakes in 2005 The horizontal axis is longitude, and the vertical axis is latitude |
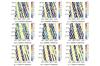 |
Fig. 4 Normalized results for the four parameters on ISL load without earthquakes in 2005 The horizontal axis is longitude, and the vertical axis is latitude |
3.3 Pre-Earthquake Ionospheric Anomalies in Wenchuan
The information of abnormal regions of parameters in Wenchuan earthquake is shown in Table 1, and the normalized data of several parameters before the Wenchuan earthquake are shown in Fig. 5. From Fig. 5, we can see that there is one anomaly in the PSD of the SLF and LF bands in the ICE load; there is one anomaly in the H+ concentration, one anomaly in the He+ concentration, two anomalies in the Ti in the IAP load, and one anomaly in the Ni in the ISL load. In this paper, a small grid is selected for anomaly observation in the time dimension from the areas with the same anomaly time and not far away from the anomaly location, and each anomaly area is circled in red in Fig. 5 and numbered according to the load type, as shown in Table 1.
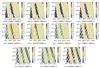 |
Fig. 5 Normalization results of each parameter in Wenchuan earthquake The horizontal axis is longitude, and the vertical axis is latitude |
Figures 6 and 7 show the daily mean variation curves of the parameters in the two anomalous regions extracted by the load ICE, where  represents the mean value of the corresponding abnormal region and
  represents the standard deviation. The comparison of Fig. 5, Fig. 6 and Fig. 7 shows that the PSD in the SLF band was anomalously enhanced on the 2nd day before the earthquake and the LF band on the 5th day before the earthquake, both at the southwest of the epicenter. Figures 8-11 show the results of the load IAP in the time dimension.
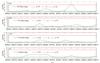 |
Fig. 6 Daily average variation curves of each parameter in ICE load anomaly region 1 |
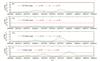 |
Fig. 7 Daily average variation curves of each parameter in ICE load anomaly region 2 |
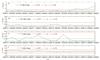 |
Fig. 8 Daily average variation curves of each parameter in IAP load anomaly region 1 |
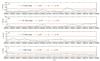 |
Fig. 9 Daily average variation curves of each parameter in IAP load anomaly region 2 |
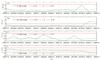 |
Fig. 10 Daily average variation curves of each parameter in IAP load anomaly region 3 |
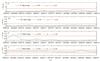 |
Fig. 11 Daily average variation curves of each parameter in IAP load anomaly region 4 |
Combining with Fig. 5(e), we can see that there is a large-scale anomalous enhancement of H+ concentration on the day of the Wenchuan earthquake. In addition, Fig. 8 and Fig. 10 show the anomalous enhancement of H+ concentration and weakening of Ti on 19 July 2008, and Fig. 8 and Fig. 9 show the anomalous enhancement of both H+ and He+ concentration on 01 August 2008, which may be related to other earthquake cases. In comparison with Fig. 5, the anomalous enhancement of Ni on the first day before the earthquake can be seen in Fig. 12.
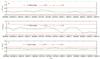 |
Fig. 12 Daily average variation curves of each parameter in ISL load anomaly region 1 |
Information of abnormal regions of parameters in Wenchuan earthquake
4 Conclusion
In this paper, we study the pre-earthquake ionospheric anomalies of the Wenchuan earthquake using multiple parameter data recorded by three payloads on the DEMETER satellite. Through the background analysis and the combination of the anomalous results extracted in both spatial and temporal dimensions, the following conclusions can be summarized:
1) The overall distribution of PSD values in the upper air SLF, ULF, and VLF bands in the Wenchuan region is relatively uniform, with no noticeable feature of changing with latitude and longitude, basically distributed within -1-1; the values of LF band PSDs have a trend of increasing with longitude in spatial distribution. The spatial distributions of O+ concentration, Ne and Ni are relatively The spatial distribution of O+ concentration, Ne and Ni are relatively uniform, and the spatial characteristics of H+ concentration, He+ concentration, Ti, and Te clearly tend to increase with increasing dimensionality.
2) Before the Wenchuan earthquake, the PSD values of the SLF and LF bands in the ICE load are anomalously enhanced in the southwest direction of the epicenter; the H+ concentration in the IAP load is anomalously enhanced in a relatively large range, the He+ concentration is anomalously enhanced in the northward direction of the epicenter, and Ti is anomalously weakened in the northward movement of the epicenter; Ni in the ISL load is anomalously enhanced in the eastward direction of the center.
In the process of using DEMETER satellite data, it is found that there are spatial and temporal discontinuities and missing data recorded by such low-orbiting satellites, which will bring some influence to the experimental results, and the anomalous information obtained needs further verification.
Acknowledgments
Thanks to the DEMETER data center in France for providing ICE, IAP, and ISL load data for this paper.
References
- Larkina V I, Nalivayko A V, Gershenzon N I, et al. Observations of VLF emission, related with seismic activity, on the Interkosmos-19 satellite[J]. Geomagnetism and Aeronomy, 1983, 23(5): 684-687. [NASA ADS] [Google Scholar]
- Chmyrev V M, Isaev N V, Serebryakova O N, et al. Small-scale plasma inhomogeneities and correlated ELF emissions in the ionosphere over an earthquake region[J]. Journal of Atmospheric and Solar-Terrestrial Physics, 1997, 59(9): 967-974. [NASA ADS] [CrossRef] [Google Scholar]
- Hayakawa M, Molchanov O A. Achievements of NASDA's earthquake remote sensing frontier project[J]. Terrestrial, Atmospheric and Oceanic Sciences, 2004, 15(3): 311-327. [NASA ADS] [CrossRef] [Google Scholar]
- Zeng Z C, Zhang B, Fang G Y, et al. An analysis of ionospheric variations before the Wenchuan earthquake with DEMETER data[J]. Chinese Journal of Geophysics, 2009, 52(1): 13-22. [CrossRef] [Google Scholar]
- Hayakawa M, Kasahara Y, Nakamura T, et al. A statistical study on the correlation between lower ionospheric perturbations as seen by subionospheric VLF/LF propagation and earthquakes[J]. Journal of Geophysical Research: Space Physics, 2010, 115(A9): A09305. [NASA ADS] [Google Scholar]
- Liu J Y, Chen Y I, Chen C H, et al. Seismoionospheric GPS total electron content anomalies observed before the 12 May 2008 Mw7.9 Wenchuan earthquake[J]. Journal of Geophysical Research: Space Physics, 2009, 114(A4): A04320. [NASA ADS] [Google Scholar]
- Zhang X, Shen X, Liu J, et al. Analysis of ionospheric plasma perturbations before Wenchuan earthquake[J]. Natural Hazards and Earth System Sciences, 2009, 9(4): 1259-1266. [NASA ADS] [CrossRef] [Google Scholar]
- He J H, Zhang X M, Lin J, et al. Coseismic ionosphere disturbances of the 2008 Wenchuan earthquake[J]. Earthquake, 2017, 37(2): 126-134(Ch). [Google Scholar]
- Yang J, Hu Y G, Zhao Z Y. Summer's ionosphere VLF background analysis in Wenchuan area[J]. Progress in Geophysics, 2021, 36(2): 531-539(Ch). [NASA ADS] [Google Scholar]
- Parrot M, Benoist D, Berthelier J J, et al. The magnetic field experiment IMSC and its data processing onboard DEMETER: Scientific objectives, description and first results[J]. Planetary and Space Science, 2006, 54(5): 441-455. [NASA ADS] [CrossRef] [Google Scholar]
- Sharma D K, Rai J, Chand R, et al. Effect of seismic activities on ion temperature in the F2 region of the ionosphere[J]. Atmósfera, 2006, 19(1): 1-7. [Google Scholar]
- Dobrovolsky I P, Zubkov S I, Miachkin V I. Estimation of the size of earthquake preparation zones[J]. Pure and Applied Geophysics, 1979, 117(5): 1025-1044. [NASA ADS] [CrossRef] [Google Scholar]
All Tables
All Figures
|
Fig. 1 Background mean plot for each parameter The horizontal axis is longitude, and the vertical axis is latitude |
| In the text | |
|
Fig. 2 Normalized results for the four parameters on ICE load without earthquakes in 2005 The horizontal axis is longitude, and the vertical axis is latitude |
| In the text | |
|
Fig. 3 Normalized results for the four parameters on IAP load without earthquakes in 2005 The horizontal axis is longitude, and the vertical axis is latitude |
| In the text | |
|
Fig. 4 Normalized results for the four parameters on ISL load without earthquakes in 2005 The horizontal axis is longitude, and the vertical axis is latitude |
| In the text | |
|
Fig. 5 Normalization results of each parameter in Wenchuan earthquake The horizontal axis is longitude, and the vertical axis is latitude |
| In the text | |
|
Fig. 6 Daily average variation curves of each parameter in ICE load anomaly region 1 |
| In the text | |
|
Fig. 7 Daily average variation curves of each parameter in ICE load anomaly region 2 |
| In the text | |
|
Fig. 8 Daily average variation curves of each parameter in IAP load anomaly region 1 |
| In the text | |
|
Fig. 9 Daily average variation curves of each parameter in IAP load anomaly region 2 |
| In the text | |
|
Fig. 10 Daily average variation curves of each parameter in IAP load anomaly region 3 |
| In the text | |
|
Fig. 11 Daily average variation curves of each parameter in IAP load anomaly region 4 |
| In the text | |
|
Fig. 12 Daily average variation curves of each parameter in ISL load anomaly region 1 |
| In the text | |
Current usage metrics show cumulative count of Article Views (full-text article views including HTML views, PDF and ePub downloads, according to the available data) and Abstracts Views on Vision4Press platform.
Data correspond to usage on the plateform after 2015. The current usage metrics is available 48-96 hours after online publication and is updated daily on week days.
Initial download of the metrics may take a while.