Open Access
Fig. 2
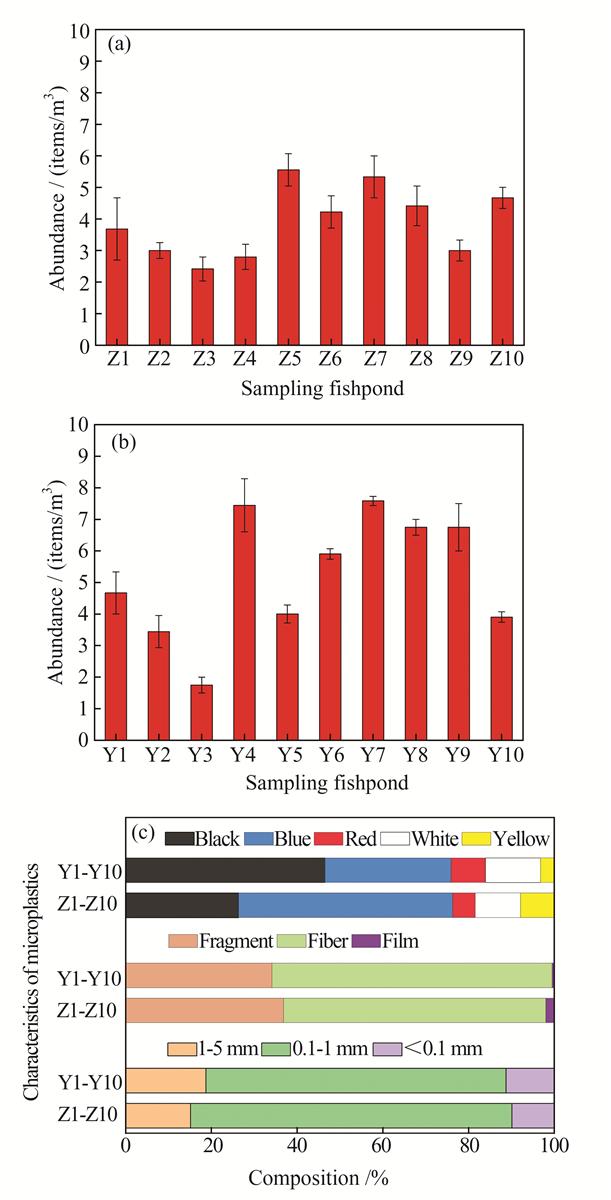
Abundance and distribution of microplastics in water of fishponds
Download original image
(a) Abundance of microplastics in ZJ experimental station; (b) Abundance of microplastics in YD experimental station; (c) Size, shape, and color distribution as a percentage of total microplastics in water
Current usage metrics show cumulative count of Article Views (full-text article views including HTML views, PDF and ePub downloads, according to the available data) and Abstracts Views on Vision4Press platform.
Data correspond to usage on the plateform after 2015. The current usage metrics is available 48-96 hours after online publication and is updated daily on week days.
Initial download of the metrics may take a while.