| Issue |
Wuhan Univ. J. Nat. Sci.
Volume 30, Number 3, June 2025
|
|
|---|---|---|
| Page(s) | 302 - 312 | |
| DOI | https://doi.org/10.1051/wujns/2025303302 | |
| Published online | 16 July 2025 | |
Environmental Science
CLC number: X82
Using TOPSIS Model with Modified Entropy Weight for Water Quality Assessment in Guizhou Province, China
基于改进熵权的TOPSIS模型在中国贵州省水质评价中的应用
1 IRI Consulting Group, Beijing 100037, China
2 School of Political Science International Relations, Tongji University, Shanghai 200092, China
Received:
3
July
2024
Abstract
Although the Technique for Order Preference by Similarity to Ideal Solution (TOPSIS) model has been widely applied in water quality assessment by numerous studies, several common limitations remain unresolved. Specifically: 1) Subjective elements in methods such as fuzzy theory and the analytic hierarchy process (AHP) may distort evaluation outcomes; 2) The utilization of raw sample data is insufficient when constructing evaluation matrices; 3) The traditional entropy weight method in TOPSIS merely reflects statistical characteristics of the final matrix while neglecting richer information embedded in raw datasets. To address these issues, we proximate probability distribution function of various indicators by using cubic spline interpolation and fully exploit information in the existing massive sample data. In this paper, the entropy weight method is enhanced based on the concept mentioned above and integrated with TOPSIS model to construct a novel evaluation model. Furthermore, the experimental analysis using wastewater monitoring data from Guizhou Province, China, verifies its practicality, and its results provide valuable references for local water environmental management.
摘要
诸多研究已将TOPSIS模型应用于水质评价,但仍有共性缺陷亟待解决。具体表现为:带有主观性要素方法,如模糊理论、层次分析法等可能会扭曲评估结果;构建评价矩阵时原始样本数据利用不足;传统TOPSIS中的熵权法仅能反映最终矩阵的统计特性,却忽视了原始数据蕴含的更丰富信息。为解决上述问题,本文利用三次样条插值法近似拟合各指标的概率分布函数,深度挖掘既有海量样本数据的信息价值,并在此基础上对熵权法进行改进,与TOPSIS模型相结合,构建了一种新型评价模型。最后,以中国贵州省废水监测数据为例验证了该模型的可行性,其结果为当地区域水环境治理提供了一定的参考价值。
Key words: water quality assessment / entropy weight / cubic spline interpolation / Technique for Order Preference by Similarity to Ideal Solution (TOPSIS) / big data
关键字 : 水质评价 / 熵权 / 三次样条插值 / TOPSIS / 大数据
Cite this article: FENG Dongdong, WU Liang. Using TOPSIS Model with Modified Entropy Weight for Water Quality Assessment in Guizhou Province, China[J]. Wuhan Univ J of Nat Sci, 2025, 30(3): 302-312.
Biography: FENG Dongdong, male, research direction: econometric models, ecological environment assessment models, machine learning, and big data mining techniques. E-mail: This email address is being protected from spambots. You need JavaScript enabled to view it.
© Wuhan University 2025
 This is an Open Access article distributed under the terms of the Creative Commons Attribution License (https://creativecommons.org/licenses/by/4.0), which permits unrestricted use, distribution, and reproduction in any medium, provided the original work is properly cited.
0 Introduction
As the environmental factor intrinsically linked to public issues and habitat, water environment has always been the focus of environmentalists' attention. To control water pollution and monitor long-term or timely changes in water environment, water quality assessment has increased enormous attention for researchers. In the past two decades, there have been many researches on how to quantitatively evaluate water quality based on the entropy theory. Ma et al[1] merged the advantages of the Principal Component Analysis (PCA) and the information entropy (IE) to obtain the weights of indicators, which was established to assess the landscape water quality in Zhengzhou City, China. Mahjouri et al[2] used the discrete entropy theory to assess the efficiency of the Jajrood River monitoring network and revised both the location of existing monitoring stations and temporal frequencies of data gathering. Paul et al[3] applied information entropy to Water Quality Index (WQI) calculation and calculated the Pearson correlation matrix between different parameters for analyzing its relationship. Li et al[4] have done a lot of research work on water quality assessment based on entropy weight theory, such as integrating entropy weight theory and WQI, applying set pair analysis method based on entropy weight[5], and improving Technique for Order Preference by Similarity to Ideal Solution (TOPSIS) method based on entropy weight[6-8]. Amiri et al[9] improved WQI with entropy weight and provided the entropy weighted water quality index (EWQI) for groundwater samples in Lenjanat plain, central Iran. The experimental results indicate that application of the EWQI is greatly helpful to identify and evaluate groundwater quality in Lenjanat, Iran. Singh[10] systematically introduced the application of entropy theory in environmental and water engineering, and proposed the basic construction process of the evaluation model. Kholoosi et al[11] used Entropy Based Water Quality Index (EBWQI) to assess groundwater quality and structured a new clustering method which was proposed based on multi objective optimization for EBWQIs data sets interpretation (MOC). The effectiveness of the MOC method was verified by comparing different clustering methods. Li et al[12] proposed an improved TOPSIS-based approach called the Informative Weighting and Ranking (TIWR) method using the Criteria Importance Through Inter-criteria Correlation (CRITIC) approach, which avoids classifying several objects into the same typical level and makes them distinguishable.
TOPSIS model has been also widely applied in multiple other fields[23-24], such as enterprise strength comparison[25], safety of coal mines[26], investment decision[27], highway transportation[28], urban sustainable development[29-30], tourism competitiveness[31], agricultural water resource management[32], and so on. In the process of water quality assessment, uncertain and fuzzy factors are often encountered, so many researchers are enthusiastic about the research and application of entropy weight method based on fuzzy theory. Lots of researches have made considerable contributions to the fuzzy synthetic evaluation approaches with entropy method[13-16], and applied fuzzy theory and TOPSIS method to water quality assessment based on entropy weight[17-21]. An et al[22] introduced a fuzzy rough set to perform attribute reduction, and combined an attribute recognition theoretical model and entropy method to assess water quality.
Above, we have introduced the extensive research work of scholars on water quality assessment based on the TOPSIS model. However, there are inevitably several problems in these works. First, subjective elements such as fuzzy theory or analytic hierarchy process (AHP) introduce human bias, potentially distorting results. Second, the method emphasizes the final evaluation matrix while neglecting the rich original sample data used to construct it, often relying on regional or annual averages that reduce accuracy. Moreover, traditional entropy-based weighting only considers statistical properties within the evaluation matrix, ignoring the more precise probability information available in the original data. Therefore, based on the framework provided by the above researches, this paper proposes a modified entropy weight approach with TOPSIS model to establish an improved comprehensive evaluation method. It is targeted for the situations that the composition values of evaluation matrix are derived from a large amount of data, such as the monthly multi-site wastewater monitoring data used in this paper. With the simultaneous consideration of the impact of subjective factors, this model evaluates the performances merely on the objective data.
The main structure of the paper is as follows: In Section 1, a modified method for entropy weight is introduced thoroughly and combined with TOPSIS to construct a rational and effective evaluation model. Section 2 provides some background information about the geographical characteristics of Guizhou Province, China, the acquisition of data sources and the establishment of evaluation criteria. In Section 3, a case study of water quality assessment in Guizhou Province, China, in terms of yearly and regional analysis is conducted to examine the applicability of the proposed model. Section 4 presents the conclusion.
1 TOPSIS Model with Modified Entropy Weight
1.1 The Entropy Weight Theory
1.1.1 Information entropy
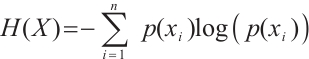
Entropy theory first appeared in thermodynamics and was later introduced into information theory by Shannon[33]. Subsequently, the concept of information entropy emerged as a measure of disorder degree and the amount of information conveyed by an event drawn from the probability distribution of a random event. In the probability distribution, the higher the probability of occurrence is, the smaller the uncertainty is and the less information it contains. Therefore, the average information provided by a random event can be quantified as follows:
where  is the value of the random variable
  ;
;  is the probability of random event
  occurring.
1.1.2 Modified entropy weight method
Information entropy can be used to measure the degree of differentiation of the indicator. The greater the dispersion degree of a indicator value, the greater the influence of the indicator on the comprehensive evaluation, and the higher weight should be given to the indicator. Differentiating from the traditional approach of processing weights in the entropy weight method, we make an improvement: Firstly, the approximate probability distribution of one indicator can be estimated from all measured value of this indicator; Secondly, the probability of every indicator value in evaluation objects can be obtained more precisely by locating it in the known probability distribution; Finally, with more accurate probabilities estimation, the accuracy of entropy calculation and the indicator weight improves, which adequately enhances the model performance. The specific implementation steps are as follows:
1) Assuming that there are  measured values for
  previously defined indicator, and
  assessment subjects, so the corresponding matrix can be expressed as:
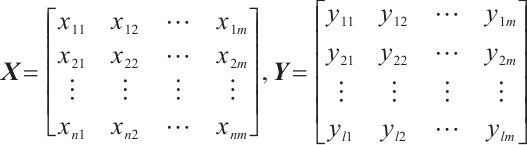
where  is the original sample data matrix,
  is the evaluation matrix,
  .
.
2) To align data values to a common scale and distribution for comparison, normalization is applied to all acquired value  for each criterion. After the subtraction-based conversion procedure and frequency calculation in terms of
  -th indicator, we proximate the probability distribution
  for it by interpolating all handled data into cubic splines functions[34-36]. The procedures are described as follows:
a) To unify indicator type, the subtraction-based conversion procedure is applied as follows:
For the benefit indicator: 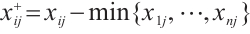 ;
;
For the cost indicator: 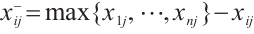 ;
;
For the interval indicator:

b) Build a frequency table  for each converted indicator value
 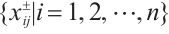 and transform it into
  which is the approximate probability of
  with being obtained by using the frequency
  divided by the total number of values.
c) Proximate the probability distribution  by fitting
  with cubic spline interpolation method as follows:

 (1)
(1)
where  is the sample data number index,
  is the indicator index,
  is the corresponding value located in the sample data,
  is the ideal value of the
  -th indicator,
  is the cubic spline interpolation function of
  , and
, and  is the data point of
  ,
,  .
.
3) Calculate the entropy of each dimension of assessment subject  based on the probability distribution of each indicator. Its expressions are shown as follows:
where  is the probability of
  by (1),
  .
.
4) The weight of  -th evaluation indicator is expressed as follows:
 (2)
(2)
1.2 The Methodology of TOPSIS
TOPSIS is a multiple objective decision making method which was firstly proposed by Hwang and Yoon in 1981[37], and Yoon made some further researches in 1995[38]. TOPSIS, which uses the comparison between the distance of the solution from the positive ideal solution and the distance of the solution from negative ideal solution, determines the priority order of the assessed subjects. Positive ideal solution is defined as the composition of all the best value achieved for each indicator, while negative ideal solution contains all the worst value. The evaluation procedures of TOPSIS method are as follows:
1) Calculate the weighted normalized decision matrix
2) Determine the positive ideal solution  and the negative solution
  :
:
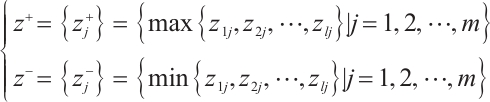 (3)
(3)
3) Calculate the Euclidean distance of each assessment subject to positive ideal solution  and negative ideal solution
  :
:
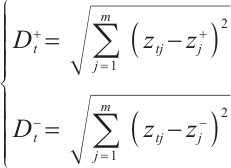 (4)
(4)
4) Calculate the similarity of each assessment subject  to the worst condition, and obtain the corresponding grade in centesimal grade system. The higher the grade, the better the evaluation result of this alternative subject.
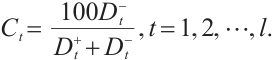 (5)
(5)
1.3 TOPSIS with Modified Entropy Weight
Based on the concept and methodology mentioned in Sections 1.1 and 1.2, the application steps (evaluation procedure) for the TOPSIS model with our modified entropy weights (as MEW-TOPSIS below) can be briefed as follows:
Step 0. Normalize data and calculate approximate probability distribution  by Eq. (1).
Step 1. Determine the weight of j-th indicator by Eq. (2).
Step 2. Calculate the distance of each assessed subject to the positive ideal solution  and the negative ideal solution
  by Eq. (4).
Step 3. Sort the grade of assessment subjects from smallest to largest by Eq. (5).
1.4 Rank Correlation Knowledge
In statistics, the two commonly-used measures of statistical dependence between two ranked variable are Spearman[39] and Kendall[40] rank correlation coefficient. In Section 3, to examine the effectiveness and superiority of the proposed model, these two coefficients are set as the performance indicators for different evaluation methods. The calculation formulas for these two coefficients are expressed as follows: Spearman rank correlation coefficient is given by
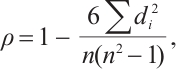 (6)
(6)
where  is the difference between paired ranks, n is the number of paired items,
  .
.
Kendall rank correlation coefficient is given by
 (7)
(7)
where p is the number of pairs items in the same order,  .
.
2 Supplementary Information
2.1 Geological Information
Guizhou Province is located in the Yunnan-Guizhou Plateau of China, between 103°36′E - 109°35′E and 24°37′N - 29°13′N. As of 2021, the total area of the province is 176 200 km2, accounting for 1.8% of the national total area. With 6 prefecture level cities and 3 autonomous prefectures, the province has a permanent population of 38.52 million people.
There are many rivers in Guizhou Province, and there are 984 rivers with length over 10 km, such as Wujiang River, Chishui River, Qingshui River, Nanpanjiang River, Beipanjiang River and Hongshui River, etc. In 2021, the river runoff in Guizhou Province reaches 105.3 billion cubic meters. The mountainous features of Guizhou's rivers are obvious. Most of the upstream rivers have open valleys with gentle water flow and little water volume; the midstream rivers have interlocking valleys with rapid water flow; the downstream rivers have deep and narrow valleys with large water volume and rich hydraulic resources.
2.2 Data Acquisition
The sample data used in this paper is the site-specific estimates of contaminant exposure (mainly concentration or concentration statistics) acquired from the wastewater monitoring system of large-scale companies in Guizhou Province, and is published by the Department of Ecology and Environment of Guizhou Province on its official website. By focusing on the water quality within recent years, the data in the period from 2018 to 2022 is selected. The number of data resource are represented in Fig. 1. We can know from Fig. 1(b) that Guiyang City, as the capital city of Guizhou Province, has a total number of 4 100 data values acquired from 2018 to 2022 with ranking first among 9 prefecture-level divisions.
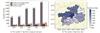 |
Fig. 1 Number of related data resource |
2.3 Evaluation Criteria
The Ministry of Ecology and Environment of the People's Republic of China promulgated the China Surface Water Environmental Quality Standard (GB3838-2002) in 2002, listing 24 representative indicators and the national-scale benchmarks for screening-level assessment of surface water environmental quality. However, considering the difficulty of data access and the scarcity of sample data on some attributes, 18 indicators were chosen for the assessment criteria and presented in Table 1 with the corresponding threshold values and levels of water quality.
Surface Water Environmental Quality Standard limits
3 Result and Discussion
In this section, we apply the proposed model for yearly evaluation water quality across the regions in Guizhou Province with the dataset and criteria mentioned in Sections 2.2 and 2.3. As the implementation procedure stated in Section 1, estimated probability distribution for each criterion is fitted by all sample data of it, presented as a separated graph in Fig. 2. From the visualization of probability distributions, we can figure out that the fitted probability distributions are generally in line with the actual situation, except for some points in Fig. 2(j) that deviate slightly.
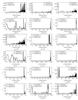 |
Fig. 2 Cubic spline interpolation of probability distribution 
|
In order to scientifically and comprehensively demonstrate the overall changes of water environment in Guizhou Province, the comparative analysis is conducted from two aspects. On the one hand, to see the trend over time, our evaluation is based on the yearly average value of each criterion from 2018 to 2022; On the other hand, in a comprehensive water quality evaluation, the regional comparative analysis should be concerned, so an analysis based on the yearly average of each criterion of every prefecture-level division from 2018 to 2022 has been run.
3.1 Annual Analysis (2018-2022)
The yearly average values of predetermined indicator from 2018 to 2022 are shown in Table 2. The evaluation matrix  in our model is composed of each of them.
To prove the effectiveness and superiority of the methodology proposed in this paper, we selected the other two approaches to run comparative analysis as follows:
a) TEW: Use traditional entropy weight methodology for calculating weights, where  and
and  has been normalized by Max-Minimum regularization method;
b) Wei(x): Use the methodology proposed by Chiang et al[41] to calculate the entropy weight, where

c) MEW: Use the modified entropy weight methodology proposed in this paper (see Section 1.3).
Baijiu (a special Chinese liquor) industry is known as one of the pillar industries and has been the mainly driving force of economic growth in Guizhou Province. It is logical to infer that there exists a direct relationship between the output of Baijiu and the quality of water environment because the volume of industrial sewage discharged will inevitably increases once the production volume of Baijiu increases. Therefore, the evaluation model performance can be measured by the correlation between the annual output of Baijiu and the yearly grade got from model. For this, Spearman and Kendall rank correlation coefficients are selected as the reasonable indicators of model performance (see Section 1.4). Moreover, the data related to Baijiu we used is the annual output of Baijiu enterprises above designated size in 2018-2022 published by National Bureau of Statistics. The related results are shown in Table 3.
Both rank correlation coefficients show that there is a negative correlation between Baijiu production and water quality. This is consistent with the inference mentioned above. Furthermore, these two rank correlation coefficients, which are also indicators of model performance, turn out to be closer to -1 while calculating the correlation between the evaluation result obtained from our proposed model and annual output of Baijiu, sufficiently justifing that it is a more favorable approach than the other two. Additionally, it is noticeable that the annual output of Baijiu in 2020 was the lowest. Part of the reason for this is the outbreak of the COVID-19 epidemic. There were severe disruptions on economy and society triggered by this, including decreased social mobility, slow-down in all industry production and so on. Reduced human activity led to predictable decrease in pollution, so that the volume of sewage discharged hit the bottom in this year, and water environment improved significantly at same time, which is precisely consistent with the rank-order of the evaluation grade in 2020 got by our proposed model.
Annual average data from 2018 to 2022
Annual evaluation score and rank
3.2 Regional Analysis
There are nine prefecture-level divisions in Guizhou Province, including Guiyang, Zunyi, Bijie, Liupanshui, Qiandongnan, Qianxinan, Qiannan, Tongren and Anshun. The evaluation from a regional perspective is beneficial to understand the detailed changes in the water environment of Guizhou Province, and build a dynamic pollution map based on the inter-regional comparison with the time trend basically. Similarly, we use the novel methodology MEW-TOPSIS to evaluate the water quality of these nine regions on an annual basis (see Table 4).
The evaluation results show that the water quality of most cities in Guizhou Province has decreased to varying degrees in the past two years, except for Zunyi and Bijie which have a significant improvement in water quality. As the political, economic, cultural, educational, scientific and technological center of Guizhou Province, Guiyang has maintained a high social mobility and orderly production operations for three years since the COVID-19 epidemic, and the water quality has slightly declined. After the epidemic, the resumption of work and production will be promoted in a sequential manner. In this process, it is even more important to strengthen the protection of the water environment, strictly control the discharge of sewage, and improve the environmental protection awareness of production enterprises. In addition, the water environment in the three southern autonomous prefectures of Guizhou Province has also deteriorated, which requires high attention from local departments.
Evaluation score rank of area
4 Conclusion
With the subtle improvement in entropy weight methodology, the modified model we proposed exploits the useful information of data to a maximum extent. The improvement is specified as using cubic spline interpolation to fit a more proper and accurate probability distribution for each indicator in evaluation and substituting the original way of probability calculation for the entropy weight method with it. Then, an improved comprehensive evaluation model for water quality is constructed scrupulously by combining it with the TOPSIS model. To prove its practicality and superiority, a case study of water quality assessment of Guizhou Province was conducted by using the wastewater monitoring data of large-scale companies, and two rank correlation coefficients are set as model performance indicators on the foundation of a solid inference about the relationship between the production Baijiu and water environment. In final, the outcomes not only suggest the boosted effectiveness and accuracy of model but also projects a simplified panorama of water quality changes of Guizhou Province in recent five years, which contributes to remind some local authorities specially the ones in Bijie and Zunyi city to pay more attention to the water environment and enforce pollution control at sources. In addition to be applied on water quality assessment, the high flexibility and versatility of the model we proposed is expected to accommodate further extensions and be put into practice in various fields.
References
- Ma J Q, Guo J J, Liu X J. Water quality evaluation model based on principal component analysis and information entropy: Application in Jinshui River[J]. Journal of Resources and Ecology, 2010, 1(3): 249-251, 252(Ch). [Google Scholar]
- Mahjouri N, Kerachian R. Revising river water quality monitoring networks using discrete entropy theory: The Jajrood River experience[J]. Environmental Monitoring and Assessment, 2011, 175(1/2/3/4): 291-302. [Google Scholar]
- Paul S, Mishra U. Assessment of underground water quality in North Eastern region of India: A case study of Agartala City[J]. International Journal of Environmental Sciences, 2011, 2(2): 850-862. [Google Scholar]
- Li P Y, Qian H, Wu J H. Groundwater quality assessment based on improved water quality index in Pengyang County, Ningxia, Northwest China[J]. Journal of Chemistry, 2010, 7(S1): S209-S216. [Google Scholar]
- Li P Y, Qian H, Wu J H. Application of set pair analysis method based on entropy weight in groundwater quality assessment—A case study in Dongsheng City, Northwest China[J]. Journal of Chemistry, 2011, 8(2): 851-858. [Google Scholar]
- Li P Y, Qian H, Wu J H. Hydrochemical formation mechanisms and quality assessment of groundwater with improved TOPSIS method in Pengyang County Northwest China[J]. Journal of Chemistry, 2011, 8(3): 1164-1173. [Google Scholar]
- Li P Y, Wu J H, Qian H. Groundwater quality assessment based on rough sets attribute reduction and TOPSIS method in a semi-arid area, China[J]. Environmental Monitoring and Assessment, 2012, 184(8): 4841-4854. [Google Scholar]
- Li P Y, Qian H, Wu J H, et al. Sensitivity analysis of TOPSIS method in water quality assessment: I. Sensitivity to the parameter weights[J]. Environmental Monitoring and Assessment, 2013, 185(3): 2453-2461. [Google Scholar]
- Amiri V, Rezaei M, Sohrabi N. Groundwater quality assessment using entropy weighted water quality index (EWQI) in Lenjanat, Iran[J]. Environmental Earth Sciences, 2014, 72(9): 3479-3490. [Google Scholar]
- Singh V P. Entropy Theory and Its Application in Environmental and Water Engineering[M]. Hoboken: Wiley-Blackwell, 2013. [Google Scholar]
- Kholoosi M M, Aberi P, Arabzadeh R, et al. Water quality assessment using entropy based water quality index and application of a new clustering approach[C]// 10th International Congress on Civil Engineering. Tabriz: University of Tabriz, 2015. [Google Scholar]
- Li Z Y, Yang T, Huang C S, et al. An improved approach for water quality evaluation: TOPSIS-based informative weighting and ranking (TIWR) approach[J]. Ecological Indicators, 2018, 89: 356-364. [Google Scholar]
- Zou Z H, Yun Y, Sun J N. Entropy method for determination of weight of evaluating indicators in fuzzy synthetic evaluation for water quality assessment[J]. Journal of Environmental Sciences, 2006, 18(5): 1020-1023. [Google Scholar]
- Zhu Z G, Zhang L, Wei S Y. A combination model and application for the water quality evaluation[J]. WSEAS Transactions on Systems, 2009, 85: 628-637. [Google Scholar]
- Liu L, Zhou J Z, An X L, et al. Using fuzzy theory and information entropy for water quality assessment in Three Gorges region, China[J]. Expert Systems with Applications, 2010, 37(3): 2517-2521. [Google Scholar]
- Xing Z X, Fu Q, Liu D. Water quality evaluation by the fuzzy comprehensive evaluation based on EW method[C]//2011 Eighth International Conference on Fuzzy Systems and Knowledge Discovery (FSKD). New York: IEEE, 2011: 476-479. [Google Scholar]
- Hung C C, Chen L H. A fuzzy TOPSIS decision making model with entropy weight under intuitionistic fuzzy environment [C]// Proceedings of the International Multiconference of Engineers and Computer Scientists. Hong Kong: International Association of Engineers 2009, 1: 13-16. [Google Scholar]
- Won K, Chung E S, Choi S U. Parametric assessment of water use vulnerability variations using SWAT and fuzzy TOPSIS coupled with entropy[J]. Sustainability, 2015, 7(9): 12052-12070. [Google Scholar]
- Komasi M, Sharghi S. Surface water quality assessment and prioritize the factors pollute this water using TOPSIS fuzzy hierarchical analysis[J]. Journal of Environmental Health Engineering, 2017, 4(2): 174-184. [Google Scholar]
- Tu Y, Chen K, Wang H Y, et al. Regional water resources security evaluation based on a hybrid fuzzy BWM-TOPSIS method[J]. International Journal of Environmental Research and Public Health, 2020, 17(14): 4987. [Google Scholar]
- Wu Q H, Gao L, Gu X B. The assessment of water quality in the Ningxia Section of the Yellow River using intuitionistic fuzzy sets-TOPSIS model[J]. Polish Journal of Environmental Studies, 2022, 31(6): 5905-5914. [Google Scholar]
- An Y, Zou Z H, Li R R. Water quality assessment in the Harbin reach of the Songhuajiang River (China) based on a fuzzy rough set and an attribute recognition theoretical model[J]. International Journal of Environmental Research and Public Health, 2014, 11(4): 3507-3520. [Google Scholar]
- Ren L F, Zhang Y Q, Wang Y R, et al. Comparative analysis of a novel M-TOPSIS method and TOPSIS[J]. Applied Mathematics Research Express, 2007, 2007: abm005. [Google Scholar]
- Krohling R A, Pacheco A G. A-TOPSIS—An approach based on TOPSIS for ranking evolutionary algorithms[J]. Procedia Computer Science, 2015, 55: 308-317. [Google Scholar]
- Deng H P, Yeh C H, Willis R J. Inter-company comparison using modified TOPSIS with objective weights[J]. Computers & Operations Research, 2000, 27(10): 963-973. [Google Scholar]
- Li X X, Wang K S, Liu L W, et al. Application of the entropy weight and TOPSIS method in safety evaluation of coal mines[J]. Procedia Engineering, 2011, 26: 2085-2091. [Google Scholar]
- Hsu L C. Investment decision making using a combined factor analysis and entropy-based TOPSIS model[J]. Journal of Business Economics and Management, 2013, 14(3): 448-466. [Google Scholar]
- Li Y C, Zhao L, Suo J J. Comprehensive assessment on sustainable development of highway transportation capacity based on entropy weight and TOPSIS[J]. Sustainability, 2014, 6(7): 4685-4693. [Google Scholar]
- Ding L, Shao Z F, Zhang H C, et al. A comprehensive evaluation of urban sustainable development in China based on the TOPSIS-entropy method[J]. Sustainability, 2016, 8(8): 746. [Google Scholar]
- Li W W, Yi P T, Zhang D N. Sustainability evaluation of cities in Northeastern China using dynamic TOPSIS-entropy methods[J]. Sustainability, 2018, 10(12): 4542. [Google Scholar]
- Gu T, Ren P Y, Jin M Z, et al. Tourism destination competitiveness evaluation in Sichuan Province using TOPSIS model based on information entropy weights[J]. Discrete and Continuous Dynamical Systems-S, 2019, 12(4&5): 771-782. [Google Scholar]
- Li M, Sun H, Singh V P, et al. Agricultural water resources management using maximum entropy and entropy-weight-based TOPSIS methods[J]. Entropy, 2019, 21(4): 364. [Google Scholar]
- Shannon C E. A mathematical theory of communication[J]. The Bell System Technical Journal, 1948, 27(3): 379-423. [CrossRef] [Google Scholar]
- Martin M. Cubic spline interpolation of continuous functions[J]. Journal of Approximation Theory, 1974, 10(2): 103-111. [Google Scholar]
- McKinley S, Levine M. Cubic spline interpolation[J]. College of the Redwoods, 1998, 45(1): 1049-1060. [Google Scholar]
- Dierckx P. A fast algorithm for smoothing data on a rectangular grid while using spline functions[J]. SIAM Journal on Numerical Analysis, 1982, 19(6): 1286-1304. [Google Scholar]
- Hwang C L, Yoon K. Multiple Attribute Decision Making: Methods and Applications[M]. Berlin: Springer-Verlag, 1981. [Google Scholar]
- Yoon K, Hwang C L. Multiple attribute decision making[J]. European Journal of Operational Research, 1995, 4(4): 287-288. [Google Scholar]
- Spearman C. The proof and measurement of association between two things[J]. The American Journal of Psychology, 1987, 100(3/4): 441-471. [CrossRef] [PubMed] [Google Scholar]
- Kendall M G. Rank Correlation Methods[M]. 4th Edition. London: Griffin, 1970. [Google Scholar]
- Chiang Y M, Hsieh H H. The use of the Taguchi method with grey relational analysis to optimize the thin-film sputtering process with multiple quality characteristic in color filter manufacturing[J]. Computers & Industrial Engineering, 2009, 56(2): 648-661. [Google Scholar]
All Tables
All Figures
|
Fig. 1 Number of related data resource |
| In the text | |
|
Fig. 2 Cubic spline interpolation of probability distribution
|
| In the text | |
Current usage metrics show cumulative count of Article Views (full-text article views including HTML views, PDF and ePub downloads, according to the available data) and Abstracts Views on Vision4Press platform.
Data correspond to usage on the plateform after 2015. The current usage metrics is available 48-96 hours after online publication and is updated daily on week days.
Initial download of the metrics may take a while.