| Issue |
Wuhan Univ. J. Nat. Sci.
Volume 30, Number 2, April 2025
|
|
|---|---|---|
| Page(s) | 195 - 204 | |
| DOI | https://doi.org/10.1051/wujns/2025302195 | |
| Published online | 16 May 2025 | |
Computer Science
CLC number: O177.2
Deep Learning Mixed Hyper-Parameter Optimization Based on Improved Cuckoo Search Algorithm
基于改进布谷鸟搜索算法的深度学习混合超参数优化
1
School of Computer and Artificial Intelligence, Hefei Normal University, Hefei 230601, Anhui, China
2
College of Information Science and Technology, Dalian Maritime University, Dalian 116026, Liaoning, China
Received:
18
June
2024
Abstract
Deep learning algorithm is an effective data mining method and has been used in many fields to solve practical problems. However, the deep learning algorithms often contain some hyper-parameters which may be continuous, integer, or mixed, and are often given based on experience but largely affect the effectiveness of activity recognition. In order to adapt to different hyper-parameter optimization problems, our improved Cuckoo Search(CS) algorithm is proposed to optimize the mixed hyper-parameters in deep learning algorithm. The algorithm optimizes the hyper-parameters in the deep learning model robustly, and intelligently selects the combination of integer type and continuous hyper-parameters that make the model optimal. Then, the mixed hyper-parameter in Convolutional Neural Network (CNN), Long-Short-Term Memory(LSTM) and CNN-LSTM are optimized based on the methodology on the smart home activity recognition datasets. Results show that the methodology can improve the performance of the deep learning model and whether we are experienced or not, we can get a better deep learning model using our method.
摘要
深度学习算法是一种有效的数据挖掘方法,已在许多领域得到应用。然而,深度学习算法通常包含一些超参数,这些超参数可能是连续的、整数的或混合的,并且通常是基于经验给出的,在很大程度上影响了活动识别的有效性。为了适应不同的超参数优化问题,本文提出了改进的布谷鸟搜索(CS)算法来优化深度学习算法中的混合超参数。该算法鲁棒性地优化深度学习模型中的超参数,进而智能选择使模型最优的整型和连续超参数组合。在智能家居活动识别数据集上对CNN、LSTM和CNN-LSTM中的混合超参数进行了优化。结果表明,该方法可以提高深度学习模型的性能。无论是否有经验,都可以使用我们的方法获得更好的深度学习模型。
Key words: improved Cuckoo Search algorithm / mixed hyper-parameter / optimization / deep learning
关键字 : 改进布谷鸟搜索算法 / 混合超参数 / 优化 / 深度学习
Cite this article: TONG Yu, CHEN Rong, HU Biling. Deep Learning Mixed Hyper-Parameter Optimization Based on Improved Cuckoo Search Algorithm[J]. Wuhan Univ J of Nat Sci, 2025, 30(2): 195-204.
Biography: TONG Yu, female, Ph .D., Lecturer, research direction: ambient intelligence. E-mail: This email address is being protected from spambots. You need JavaScript enabled to view it.
Foundation item: Supported by the Anhui Province Sports Health Information Monitoring Technology Engineering Research Center Open Project (KF2023012)
© Wuhan University 2025
 This is an Open Access article distributed under the terms of the Creative Commons Attribution License (https://creativecommons.org/licenses/by/4.0), which permits unrestricted use, distribution, and reproduction in any medium, provided the original work is properly cited.
0 Introduction
Over the past decade, deep learning has significantly improved performance in areas like image recognition[1], object detection[2], speech recognition[3], natural language processing[4], and activity recognition[5-6]. While effective in many applications, deep learning models are often inefficient to obtain[7] and large pre-trained models are not suitable for all scenarios, especially those with limited resources. Researchers must focus on model design, algorithm efficiency, and hyper-parameter selection. Additionally, the training process is computationally expensive and can be seen as a brute force approach. Therefore, there are still many challenges in the application of deep learning models.
Hyper-parameter selection is one of critical and challenging aspect of deep learning[8-9]. Deep learning models involve numerous hyper-parameters, typically related to the learning rate, regularization, network depth, number of filters, and their sizes. Based on their types, hyper-parameters can be classified as continuous (e.g., learning rate), integer (e.g., number of filters), or mixed, which includes both continuous and integer hyper-parameters. Hyper-parameter selection is mainly based on experience and optimization. Empirical methods, while widely used, rely on researchers' experience and often provide feasible but not optimal values, affecting model effectiveness. Optimization methods include gradient-based approaches for continuous hyper-parameters and intelligent search for integer hyper-parameters[10-11]. However, few methods exist for mixed hyper-parameter optimization(MHO), except for Optuna[12], which has recently been used for deep learning[13-14].
Considering that the Cuckoo Search(CS) algorithm has demonstrated superior performance over other intelligent evolutionary algorithms[15] and has been successfully applied to effectively solve various optimization problems[16], this paper will adopt our improved CS algorithm[17], which incorporates several recent advancements. The CS algorithm features adaptive Lévy flights, allowing for a more dynamic balance between global exploration and local exploitation. Additionally, it integrates chaotic search mechanisms to further diversify the search process and escape local optima more efficiently. This improved CS algorithm is particularly well-suited for optimizing mixed hyper-parameters, including continuous, integer, and mixed values, making it highly applicable to the optimization of deep learning model hyper-parameters.
The article is organized as follows. Section 1 present the principle and the basic CS algorithm first, and two kinds of deep learning models Convolutional Neural Network(CNN)[18] and Long-Short-Term Memory(LSTM)[19] are described, as well as the hyper-parameters they include. In Section 2, the improved CS algorithm and the methodology are described in detail. Section 3 uses three experiments to verify the effectiveness of the methodology. Section 4 summarises the article.
1 Preliminaries
Before exploring the details of the algorithm, we first introduce the basic CS algorithm as a primary component. Then, we review the hyper-parameters in some deep learning models.
1.1 Basic CS Algorithm
The CS algorithm mimics the cuckoo's search in nature for the most suitable nest to incubate its eggs. The cuckoo in the algorithm finds a better nest to incubate its eggs by selecting the nests with better quality and improving the nests with poor quality. Its characteristic is that in the optimization process, cuckoo adopts Levy flight mode and makes real-time reference to the optimal nests found so far to form an efficient optimization mode. The flowchart of basic CS algorithmis presented in Fig. 1.
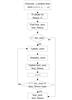 |
Fig. 1 The basic Cuckoo Search algorithm flowchart |
The traditional CS algorithm optimizes the continuous parameters whose value range is continuous interval, but it is powerless to optimize the integer parameters and mixed parameters.
1.2 Hyper-Parameters in Deep Learning Algorithms
Deep learning generally refers to a neural network that uses multi-layer nonlinear information processing for feature extraction and classification. This section will introduce the hyper-parameters in two classical deep learning models, CNN and LSTM.
A CNN is a Deep Neural Network[20] capable of acting as a feature extractor, stacking multiple convolution operators to create a hierarchy of progressively more abstract features. CNN can capture the local connection of multi-mode sensory data and the translational invariance introduced by locality leads to accurate activity recognition. This model can automatically learn multiple feature hierarchies. For a single-layer CNN, it extracts features from the input signal by performing convolution operations on the input signal.
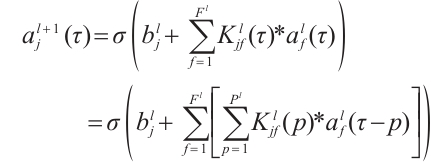
The application of the convolution operator depends on the input dimensionality. The data of sensor-based activity recognition is 1D time series and usually a 1D kernel is used for temporal convolution. In the 1D domain, a kernel can be viewed as a filter capable of removing outliers, filtering data, or acting as a feature detector, defined to maximize the response to a specific time series within the kernel's time span. For activity recognition using ubiquitous sensors, this paper chooses to use a 1D kernel . Formally, the extraction of a feature map using a one-dimensional convolution operation is given by
 (1)
(1)
where  denotes the feature map j in the layer l,
  is a non-linear function,
  is the number of feature maps in the layer l,
  is the kernel convolved over feature map f in the layer l to create the feature map j in the layer l+1,
  is the length of kernels in the layer l and
  is a bias vector. When processing sensor data, this calculation is applied to each sensor channel at the input independently.
LSTM is a special designed Recurrent Neural Network (RNN)[21] which adds a system of gating units to control the flow of information. The main goal of RNN is to model long-term dependencies and extract time-dependent features from time series. These features are particularly desirable for activity recognition due to the lack of prior knowledge of the relationship between the predicted results and the length of the input historical data. In theory, the RNN can consider the dependency of all the forward input data. However, the gradient of the RNN is easily decreased to zero or increased to infinite during the training process. The LSTM is designed to overcome the exploding/vanishing gradient problem of RNN that typically occurs when learning long-term dependencies, even at very long minimum time lags[22].
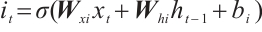
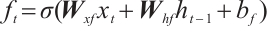
Special memory cell architecture in LSTM makes it easier to store information for long period. The standard formulation of a single LSTM cell can be given by following equations:
 (2)
(2)
 (3)
(3)
 (4)
(4)
 (5)
(5)
 (6)
(6)
where i is the input gate, f is forget gate, o is output gate, c is memory cell and h is the hidden vector sequence.  is the activation function which is sigmoid function.
 ,
,  ,
,  , and
, and  are the input weight matrices for the input gate, forget gate, output gate, and cell state candidate value, respectively. Similarly,
  ,
,  ,
,  , and
, and  are the corresponding hidden state weight matrices for these components. The bias terms
  ,
,  , and
, and  modulate the activation thresholds of their corresponding gates (input, forget, and output), whereas
  offsets the baseline of the candidate memory cell. The symbol ⊙ denotes the Hadamard product, which represents element-wise multiplication between two vectors.
For more information about the CNN and LSTM model, please refer to Ref. [23]. In the CNN model, RMSprop has continuous hyper-parameters lr and rho, and integer hyper-parameters num_filters, filter_size, and batch_size. In the LSTM model, RMSprop contains integer hyper-parameters num_units and batch_size, as well as continuous hyper-parameters lr and rho. These parameters all affect the performance of the model, and need to be appropriately selected through experience or optimization.
2 Methodology
2.1 Improved CS Algorithm
In order to optimize different types of hyper-parameters, we present an improved CS algorithm in Ref.[17]. The flowchart of the improved CS algorithm is shown in Fig. 2. The parts with blue, green, and yellow undertones are where the improved algorithm differs from the basic CS algorithm. Pa represents the probability threshold for the host bird to discover alien eggs. The improved algorithm can optimize continuous hyper-parameters, integer hyper-parameters and mixed hyper-parameters.
 |
Fig. 2 The flowchart of improved CS algorithm |
Algorithm 1 presents the improved CS algorithm and the concrete implementation steps.
| Algorithm 1 MHO based on improved CS algorithm |
|---|
Step 1. Generate m+n random host nests  , which include two part, the random continuous part , which include two part, the random continuous part  and the random integer part and the random integer part  . .Step 2. Compute the fitness  . .Step 3. Find best_nest and best_fitness. If t < iter_num, go to Step 4, else go to the last step. Step 4. Update_nests  with Lévy flights, rounding the integer part. with Lévy flights, rounding the integer part.Step 5. Compute the fitness  , if , if  , update , update  . .Step 6. Abandon_nests: for  , generate a random fraction P, if fraction P<Pa, build a new one at new locations , generate a random fraction P, if fraction P<Pa, build a new one at new locations  via Lévy flights and rounding the integer part, then update via Lévy flights and rounding the integer part, then update  . .Step 7. Calculate  at the nest for at the nest for  in the t-th iterations, and find max_fitness in the t-th iterations, and find max_fitness  and the corresponding nest and the corresponding nest , if , if  , update best_nest= , update best_nest= and best_fitness= and best_fitness= . .Step 8. t = t + 1, if t < iter_num, and best_fitness < max, go to Step 4, or else go to Step 9. Step 9. Return best_nest and best_fitness. |
2.2 Deep Learning MHO Based on Improved CS Algorithm
A deep learning model usually consists of two parts, first training the model with the training and validation data sets to get a good model, and then using this model to make predictions on the test data set. In order to get a better model, we optimize the mixed hyper-parameters. The deep learning MHO based on improved CS algorithm is described in Fig. 3. The improved algorithm is different from the original algorithm in three steps, which have been marked in gray in Fig.3. First, we determine continuous and integer hyper-parameters and their value intervals. Suppose a deep learning network topology has m+n mixed hyper-parameters, where m is the number of continuous hyper-parameters and n is the number of integer hyper-parameters. Then, mixed hyper-parameters are optimized based on improved CS algorithm. We mainly optimize mixed hyper-parameters based on training and validation datasets. In this process, we use the mixed hyper-parameters as the nest and the test results on the validation dataset as the fitness of the cuckoo optimization algorithm. Finally, the optimized hyper-parameters are substituted into the network topology to train the deep learning model. The trained model was evaluated on the test dataset.
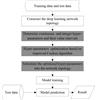 |
Fig. 3 MHO in deep learning based on improved CS algorithm |
3 Validation
This section will verify the performance of the methodology with Activities of Daily Living (ADL) Adlnormal dataset used in Ref.[24], Kasteren dataset used in Ref.[25] and Physical Activity dataset used in Ref.[26], which are three activity recognition datasets. During the experiment, 6 425 samples of Adlnormal dataset were divided into three parts: 3 000 samples were training dataset, 2 000 samples were validation dataset, and 1 425 samples were test dataset. For the Kasteren dataset, we experimented with the previous 30 000 time slices and divided the training, validation, and test data into three equal parts, i.e., 10 000 time slices each. For the Physical Activity dataset, 1 000 samples were taken from each behavior for training, verification and test, and 4 000 training samples, 4 000 verification samples and 4 000 test samples were obtained, respectively.
The following three experiments will validate the mixed hyper-parameter optimization effect of the improved CS algorithm in CNN, LSTM and CNN-LSTM , respectively.
3.1 Experiment 1
This experiment will validate the MHO effect of CNN based on the improved CS algorithm on the above three activity recognition datasets. There are integer hyper-parameters num_filters, filter_size and batch_size in CNN model, as well as continuous hyper-parameters lr and rho in RMSprop, which all affect the performance of the CNN model. When optimizing the hyper-parameters, the search interval for the hyper-parameters are  ,
,  ,
,  ,
, ,
, .
.
In order to illustrate the optimization effect, the activity recognition accuracy with MHO based on CS are compared with the activity recognition accuracy with the empirical hyper-parameters and MHO based on Optuna. Empirical hyper-parameters are set to lr=0.001, rho=0.9, num_filters=64, filter_size=5, batch_size=100. Table 1 shows the activity recognition accuracy and the total time used in training and testing for CNN with empirical hyper-parameters and different hyper-parameters optimized strategies. From the table, it can be seen that CS have improved the accuracy of activity recognition relative to empirical hyper-parameters, and outperforms Optuna in optimizing mixed hyper-parameters steadily. The last column is the total time taken to train and test the model with different hyper-parameters and the batchsize in parentheses is the batch_size value of the hyper-parameters. As can be seen from the last column of the table, the total time of the model has a strong relationship with this value, and not much with the hyperparameter optimization algorithm.
Figures 4-6 are the activity recognition accuracy change of training and validation datasets for CNN with empirical mixed hyper-parameters and different MHO strategies. In the figures, epochs refers to the number of times the training data set is traversed completely. As can be seen from the figures, the MHO based on improved CS makes the CNN models quickly reach the optimum which are similar to the empirical mixed hyper-parameters, and they all have a training advantage over the MHO based on Optuna.
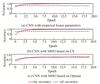 |
Fig. 4 The accuracy changes for CNN on Adlnormal dataset |
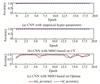 |
Fig. 5 The accuracy changes for CNN on Kasteren dataset |
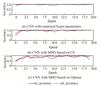 |
Fig. 6 The accuracy changes for CNN on Physical Activity dataset |
The accuracy and used time for CNN with different hyper-parameters
3.2 Experiment 2
This experiment will validate the MHO effect of LSTM based on the improved CS algorithm on the above three activity recognition datasets. There are integer hyper-parameters num_units and batch_size in LSTM model, as well as continuous hyper-parameters lr and rho in RMSprop, which affect the performance of the LSTM model. The search interval of continuous hyper-parameters are  and
and 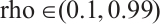 . The search interval of the integer hyper-parameters num_units and batch_size are
 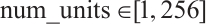 and
and  .
.
The empirical hyper-parameters of LSTM are initialized to lr=0.001, rho=0.9, num_units=128 and batch_size=200. Table 2 is the activity recognition accuracy and the total time used for LSTM in training and testing with empirical hyper-parameters, MHO based on CS and Optuna on three datasets. From the table, it can be seen that the mixed hyper-parameter optimization strategy based on CS improves the accuracy of activity recognition compared with the empirical hyper-parameters, and outperforms the mixed hyper-parameter optimization strategy based on Optuna.
Figures 7-9 are the accuracy change of training and validation datasets for LSTM with empirical mixed hyper-parameters and different mixed hyper-parameters optimized strategies on the three datasets. As can be seen from the figures, the MHO based on improved CS makes the LSTM models quickly reach the optimum, which is similar to empirical mixed hyper-parameters and has a training advantage over MHO based on Optuna.
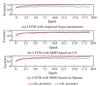 |
Fig. 7 The accuracy changes for LSTM on Adlnormal dataset |
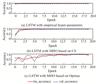 |
Fig. 8 The accuracy changes for LSTM on Kasteren dataset |
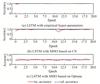 |
Fig. 9 The accuracy changes for LSTM on Physical Activity dataset |
The accuracy and used time for LSTM different hyper-parameters
3.3 Experiment 3
This experiment will validate the MHO effect of the improved CS algorithm in CNN-LSTM. CNN-LSTM is a two layers neural network with a layer of LSTM immediately following a CNN layer. Therefore, CNN-LSTM model contains both CNN and LSTM mixed hyper-parameter, namely integer super parameters num_filters, filter_size, num_units, batch_size and continuous super parameters lr, rho. The search intervals for mixed hyper-parameters are set as CNN and LSTM above.
Table 3 is the activity recognition accuracy and the total time used for CNN-LSTM in training and testing with empirical mixed hyper-parameters, MHO with CS and Optuna. Empirical mixed hyper-parameters are set as CNN and LSTM above. From the table, we can see that MHO strategy based on CS improves the accuracy of activity recognition compared with the empirical hyper-parameters, and outperforms the MHO strategy based on Optuna.
Figures 10-12 are the accuracy change of training and validation datasets for CNN-LSTM on three datasets. As can be seen from the figures, the MHO based on improved CS makes the models of CNN-LSTM quickly reach the optimum, which has a training advantage compared with MHO based on Optuna and empirical mixed hyper-parameters.
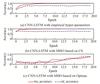 |
Fig. 10 The accuracy changes for CNN-LSTM on Adlnormal dataset |
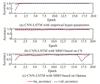 |
Fig. 11 The accuracy changes for CNN-LSTM on Kasteren dataset |
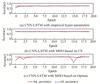 |
Fig. 12 The accuracy changes for CNN-LSTM on Physical Activity dataset |
The accuracy and used time for CNN-LSTM different hyper-parameters
3.4 Computational Complexity Analysis
For empirical hyper-parameters, experiments can be obtained without training, but some empirical knowledge is required. When using the Cuckoo algorithm to optimize the hyper-parameters, we initialize 25 nests, that is, 25 initial solutions, with 3 iterations, so that the number of computations is 25+3×25=100. In order to have the same complexity as CS algorithm, we also set the number of searches to 100 when Optuna optimizes hyper-parameters.
After obtaining the hyper-parameters, we use the hyper-parameters for model training and testing. Tables 1-3 show the total time of the hyper-parameters obtained by different algorithms in training and testing. The results show that the total time is closely related to the size of batch. The smaller the batch size, the longer the training and testing time; Conversely, the larger the batch size, the shorter the training and testing time.
4 Conclusion
This paper proposed a CS-based MHO method for deep learning models which use improved CS algorithm to optimize mixed hyper-parameter in deep learning models. To verify the methodology, we carry out sensor-based activity recognition with deep learning models CNN, LSTM and CNN-LSTM, where we optimized the mixed hyper-parameters based on CS-based MHO method and compared the results with empirical mixed hyper-parameters and Optuna-based MHO method. The experimental results show that CS-based MHO is superior to Optuna-based MHO method and empirical mixed hyper-parameters in CNN, LSTM and CNN-LSTM models for recognizing activities. During training, the CS-based MHO makes the training of the deep learning model quickly reach the optimum, which is comparable to empirical mixed hyper-parameters and has a training advantage over Optuna-based MHO method. In activity recognition accuracy, CS-based MHO mostly outperforms Optuna-based MHO and empirical data.
It follows that the proposed methodology can improve the performance of deep learning models regardless of whether the user possesses empirical knowledge. For those without empirical knowledge, this approach provides a pathway to achieve a better-performing model. For those with empirical knowledge, the methodology further enhances model performance. This method is universally beneficial, offering improvements in model quality for both experienced and inexperienced practitioners. The future work will focus on extending the proposed method by incorporating additional hyper-parameters into the optimization process to further refine its effectiveness.
Availability of data and materials
The Adlnormal dataset analyzed during the current study are available in the Dataverse repository :http://casas.wsu.edu/datasets/.
The kasteren dataset analyzed during the current study are available in the Dataverse repository :http://sites.google.com/site/tim0306/.
The Physical Activity dataset analyzed during the current study are available in the Dataverse repository :https://data.mendeley.com/datasets/sy3kcttdtx/4.
References
- Chai S, Fei X H, Wang Y L, et al. Deep learning-based lung medical image recognition[J]. International Journal of Innovative Research in Computer Science and Technology, 2024, 12(3): 100-105. [Google Scholar]
- Yadav S P, Jindal M, Rani P, et al. An improved deep learning-based optimal object detection system from images[J]. Multimedia Tools and Applications, 2024, 83(10): 30045-30072. [Google Scholar]
- Kheddar H, Hemis M, Himeur Y. Automatic speech recognition using advanced deep learning approaches: A survey[J]. Information Fusion, 2024, 109: 102422. [Google Scholar]
- Praful Bharadiya J. A comprehensive survey of deep learning techniques natural language processing[J]. European Journal of Technology, 2023, 7(1): 58-66. [Google Scholar]
- Snoun A, Bouchrika T, Jemai O. Deep-learning-based human activity recognition for Alzheimer's patients' daily life activities assistance[J]. Neural Computing and Applications, 2023, 35(2): 1777-1802. [Google Scholar]
- Chen K X, Zhang D L, Yao L N, et al. Deep learning for sensor-based human activity recognition: Overview, challenges, and opportunities[J]. ACM Computing Surveys, 2021, 54(4): 1-40. [Google Scholar]
- Tong Y, Zhu H. Hyper-parameter optimization: A review of algorithms and applications[EB/OL]. [2023-12-01]. https://arxiv.org/abs/2003.05689v1. [Google Scholar]
- Loussaief S, Abdelkrim A. Convolutional neural network hyper-parameters optimization based on genetic algorithms[J]. International Journal of Advanced Computer Science and Applications, 2018, 9(10): 252-266. [Google Scholar]
- Foysal M F A, Sultana N, Rimi T A, et al. Convolutional neural network hyper-parameter optimization using particle swarm optimization[C]//Emerging Technologies in Data Mining and Information Security. Singapore: Springer Nature Singapore, 2021: 363-373. [Google Scholar]
- Wang Y L, Zhang H X, Zhang G W. W cPSO-CNN: An efficient PSO-based algorithm for fine-tuning hyper-parameters of convolutional neural networks[J]. Swarm and Evolutionary Computation, 2019, 49: 114-123. [Google Scholar]
- Nikbakht S, Anitescu C, Rabczuk T. Optimizing the neural network hyperparameters utilizing genetic algorithm[J]. Journal of Zhejiang University:Science A, 2021, 22(6): 407-426. [Google Scholar]
- Akiba T, Sano S, Yanase T, et al. Optuna: A next-generation hyper-parameter optimization framework[C]//Proceedings of the 25th ACM SIGKDD International Conference on Knowledge Discovery & Data Mining. New York: ACM, 2019: 2623-2631. [Google Scholar]
- Ekundayo I. OPTUNA Optimization Based CNN-LSTM Model for Predicting Electric Power Consumption[D]. Dublin: National College of Ireland, 2020. [Google Scholar]
- Nishitsuji Y, Nasseri J. LSTM with forget gates optimized by Optuna for lithofacies prediction[EB/OL]. [2022-12-01]. https://research.tudelft.nl/en/publications/lstm-with-forget-gates-optimized-by-optuna-for-lithofacies-predic. [Google Scholar]
- Civicioglu P, Besdok E. A conceptual comparison of the Cuckoo-search, particle swarm optimization, differential evolution and artificial bee colony algorithms[J]. Artificial Intelligence Review, 2013, 39(4): 315-346. [Google Scholar]
- Yang X S, Deb S. Cuckoo search: Recent advances and applications[J]. Neural Computing and Applications, 2014, 24(1): 169-174. [Google Scholar]
- Tong Y, Yu B. Research on hyper-parameter optimization of activity recognition algorithm based on improved cuckoo search[J]. Entropy, 2022, 24(6): 845. [Google Scholar]
- Kim P. Convolutional neural network[C]//MATLAB Deep Learning: with Machine Learning, Neural Networks and Artificial Intelligence. Berkeley: Apress, 2017: 121-147. [Google Scholar]
- Hochreiter S, Schmidhuber J. Long short-term memory[J]. Neural Computation, 1997, 9(8): 1735-1780. [CrossRef] [Google Scholar]
- Liu W B, Wang Z D, Liu X H, et al. A survey of deep neural network architectures and their applications[J]. Neurocomputing, 2017, 234: 11-26. [CrossRef] [Google Scholar]
- Wang J J, Wen G L, Yang S P, et al. Remaining useful life estimation in prognostics using deep bidirectional LSTM neural network[C]//2018 Prognostics and System Health Management Conference (PHM-Chongqing). New York: IEEE, 2018: 1037-1042. [Google Scholar]
- Van Houdt G, Mosquera C, Nápoles G. A review on the long short-term memory model[J]. Artificial Intelligence Review, 2020, 53(8): 5929-5955. [Google Scholar]
- Ordóñez F J, Roggen D. Deep convolutional and LSTM recurrent neural networks for multimodal wearable activity recognition[J]. Sensors, 2016, 16(1): 115. [Google Scholar]
- Cook D J, Schmitter-Edgecombe M. Assessing the quality of activities in a smart environment[J]. Methods of Information in Medicine, 2009, 48(5): 480-485. [Google Scholar]
- Van Kasteren T, Noulas A, Englebienne G, et al. Accurate activity recognition in a home setting[C]//Proceedings of the 10th International Conference on Ubiquitous Computing. New York: ACM, 2008: 1-9. [Google Scholar]
- Tabbakha N E, Ooi C P, Tan W H, et al. A wearable device for machine learning based elderly's activity tracking and indoor location system[J]. Bulletin of Electrical Engineering and Informatics, 2021, 10(2): 927-939. [Google Scholar]
All Tables
All Figures
|
Fig. 1 The basic Cuckoo Search algorithm flowchart |
| In the text | |
|
Fig. 2 The flowchart of improved CS algorithm |
| In the text | |
|
Fig. 3 MHO in deep learning based on improved CS algorithm |
| In the text | |
|
Fig. 4 The accuracy changes for CNN on Adlnormal dataset |
| In the text | |
|
Fig. 5 The accuracy changes for CNN on Kasteren dataset |
| In the text | |
|
Fig. 6 The accuracy changes for CNN on Physical Activity dataset |
| In the text | |
|
Fig. 7 The accuracy changes for LSTM on Adlnormal dataset |
| In the text | |
|
Fig. 8 The accuracy changes for LSTM on Kasteren dataset |
| In the text | |
|
Fig. 9 The accuracy changes for LSTM on Physical Activity dataset |
| In the text | |
|
Fig. 10 The accuracy changes for CNN-LSTM on Adlnormal dataset |
| In the text | |
|
Fig. 11 The accuracy changes for CNN-LSTM on Kasteren dataset |
| In the text | |
|
Fig. 12 The accuracy changes for CNN-LSTM on Physical Activity dataset |
| In the text | |
Current usage metrics show cumulative count of Article Views (full-text article views including HTML views, PDF and ePub downloads, according to the available data) and Abstracts Views on Vision4Press platform.
Data correspond to usage on the plateform after 2015. The current usage metrics is available 48-96 hours after online publication and is updated daily on week days.
Initial download of the metrics may take a while.