


| Issue |
Wuhan Univ. J. Nat. Sci.
Volume 31, Number 3, June 2026
|
|
|---|---|---|
| Page(s) | 225 - 240 | |
| DOI | https://doi.org/10.1051/wujns/2026313225 | |
| Published online | 24 June 2026 | |
Computer Science
CLC number: TM732
Analysis of Tripartite Evolutionary Game in Marketization of New Energy Electricity Prices Based on Large Language Models
基于大语言模型的新能源电价市场化三方演化博弈分析: 毛卉1,2,谭本艳1†,KHANAL Ribesh1,ULLAH Obaid1,黄美忠2
1
School of Economics and Management, China Three Gorges University, Yichang 443002, Hubei, China
2
School of Artificial Intelligence and Big Data, Wuhan Business University, Wuhan 430056, Hubei, China
† Corresponding author. E-mail: This email address is being protected from spambots. You need JavaScript enabled to view it.
Received:
28
December
2025
Abstract
The newly-issued 2025 policy on deepening the market-oriented reform of new energy feed-in tariffs has exerted a profound impact on reshaping the development pattern of new energy industries, such as photovoltaic power. In this evolving context, collaborative grid-connection among photovoltaic power generation enterprises, power grid enterprises, and government agencies is crucial for enhancing the competitiveness of the new energy industry and achieving energy transition. This paper constructs a tripartite evolutionary game model to deeply explore the strategy selection and key influencing factors of each subject in the grid-connection process. It integrates large language models (LLMs) to analyze factors affecting strategy selection among different stakeholders and utilizes LLMs to capture the heterogeneous cognitive characteristics of different subjects, thereby overcoming the limitations of "strong assumptions" commonly found in traditional game models. Through multi-round semantic parsing, it identifies key influencing factors such as market-oriented electricity price fluctuations, technological innovation costs, and assessment penalty. Furthermore, based on the actual data of photovoltaic industry development in Jiangxi and Hubei Provinces, numerical simulations are employed to analyze the impact of key factors (e.g., market-oriented electricity price fluctuations) on the strategic choices of the three stakeholder parties under the new policy framework and verify the model's effectiveness. The study clarifies the critical thresholds affecting collaborative grid connection, providing a data-driven theoretical basis for the government to implement targeted policies and enterprises to optimize decision-making.
摘要
新能源上网电价市场化改革对光伏等新能源产业发展格局带来了深刻影响,在此背景下,光伏发电企业、电网企业和政府三方协同上网对提升新能源产业竞争力、实现能源转型具有重要意义。本文构建三方演化博弈模型,深入探讨各主体在上网过程中的策略选择及影响因素。将大语言模型(LLMs)整合到影响各主体策略选择的因素分析中,利用LLMs捕捉不同主体异质性认知特征,突破传统博弈模型“强假设”局限,通过多轮语义解析筛选出市场化价格波动、技术创新成本、机制电量占比等核心影响因素。进一步,本文基于江西省与湖北省光伏产业发展的实际数据,采用数值模拟方法,分析新型政策框架下市场化电价波动等关键因素对三方利益主体策略选择的影响,并验证模型有效性;识别了影响协同上网的关键阈值,为政府精准施策、企业优化决策提供了数据驱动的理论依据。
Key words: electricity marketization in 2025 / large language models (LLMs) / policy simulation / tripartite evolutionary game
关键字 : 2025年电价市场化新政策 / LLMs / 政策仿真 / 三方演化博弈
Cite this article: MAO Hui, TAN Benyan, KHANAL Ribesh, et al. Analysis of Tripartite Evolutionary Game in Marketization of New Energy Electricity Prices Based on Large Language Models[J]. Wuhan Univ J of Nat Sci, 2026, 31(3): 225-240.
Biography: MAO Hui, female, Ph.D. candidate, research direction: AI technology application. E-mail: This email address is being protected from spambots. You need JavaScript enabled to view it.
Foundation item: Supported by the National Social Science Foundation of China (23BJY013)
© Wuhan University 2026
 This is an Open Access article distributed under the terms of the Creative Commons Attribution License (https://creativecommons.org/licenses/by/4.0), which permits unrestricted use, distribution, and reproduction in any medium, provided the original work is properly cited.
0 Introduction
The expansion of new energy, particularly photovoltaic power and wind energy, has been prioritized in national policy as a fundamental element for achieving China's dual carbon goals of emission peak and carbon neutrality[1-2]. To promote the rapid development of new energy, the Chinese government has introduced incentive measures represented by feed-in tariffs (FITs)[3-7]. However, with the expanded generation of new energy power, limitations of the feed-in tariff policy have become more apparent, including insufficient motivation for enterprise innovation, increased government financial pressure, and distorted market pricing mechanisms. Thus, it has become necessary to gradually remove protections and subsidies for new energy electricity prices and encourage full market competition in new energy for deepening electricity market reforms. In February 2025, the National Development and Reform Commission issued the Notice on Deepening the Market-Oriented Reform of New Energy Feed-in Tariffs and Promoting the High-Quality Development of New Energy ("Document No. 136"), whose core is to promote comprehensive marketization of new energy electricity prices.
The new "Document No. 136" will profoundly reshape the interests and decision logic of three key entities: new energy power generators, power grid enterprises, and governments. New energy generators will face market-oriented electricity price fluctuations and largely cancelled subsidies; their development will depend on technological innovation, cost reduction, operational efficiency, and market opportunity identification. Their strategies (active/passive grid-connection) are constrained by the balance between market returns and innovation costs. Power grid enterprises must enhance new energy absorption capacity and maintain grid stability; their strategies (active/passive cooperation) depend on balancing grid transformation investment costs and new energy absorption obligations. Governments need to shift from "direct intervenors" to "rule-makers and supervisors"; their strategies (strong supervision/weak supervision) must balance regulatory costs (e.g., subsidies), potential benefits (e.g., tax revenue), and policy goals (e.g., a higher proportion of new energy). Under this policy, the three parties' strategic choices are highly interactive and game-oriented, with their final decisions significantly affecting policy effectiveness and the sustainability of the new energy industry.
A new policy's ability to meet expected goals hinges on stakeholders reaching a stable, coordinated strategic equilibrium[8-9]. Under the new energy electricity price marketization framework of "Document No. 136", the enthusiasm of new energy enterprises for grid connection, the cooperative integration by power grid enterprises, and government regulatory intervention are interdependent and mutually constraining. Any party's strategic deviation, such as new energy enterprises passively responding to market risks, power grid enterprises delaying transformation investment, or governments over-regulating or under-regulating, may reduce policy effectiveness or cause failure. Thus, in-depth analysis of the policy's incentive and constraint mechanisms on the three entities' decision-making, and revelation of the dynamic process and stable conditions of their strategic interaction evolution, is theoretically and practically significant for evaluating policy effectiveness and guiding benign collaboration.
Current research on electricity market policy effects has yielded some achievements[10-16], but gaps exist in methodology and objects. On one hand, studies on electricity market policies (including investment decisions, trading mechanisms, and quota systems) mostly focus on game analysis in traditional energy or mixed markets[8,17-19]. Special evaluations of new policies for new energy electricity price reform, such as "Document No. 136", which centers on comprehensive market-oriented pricing, remain scarce. Moreover, existing literature mainly involves policy interpretation and qualitative recommendations[20-23], lacking support from data-driven simulation experiments.
On the other hand, regarding policy research methodologies, evolutionary game theory has become a mainstream tool for analyzing multi-agent policy responses, as it can effectively depict dynamic strategy adjustments among boundedly rational agents[8,24-27]. However, traditional game models often rely on researchers' subjective assumptions of "representative agents" and "rational expectations". The selection of influencing factors in such models may deviate from agents' complex considerations in real decision-making, risking disconnection between models and reality due to "strong assumptions"[28]. In recent years, large language models (LLMs) have shown great potential in simulating human decision-making. Studies indicate they can exhibit certain economic rationality without explicit optimization guidance and map behavioral characteristics of different groups in specific scenarios[28-31]. This offers a novel solution to the shortcoming of traditional game theory methods.
This paper proposes a simulation analysis framework integrating LLM screening and a tripartite evolutionary game, aiming to more realistically evaluate the policy effects of "Document No. 136". Given that photovoltaic power generation is a major new energy source[32-35], this paper selects photovoltaic power generation enterprises for simulation research.
This paper's research approach is as follows. First, four mainstream LLMs (DeepSeek-V3, ChatGPT-4.1, Llama-4-Scout-B10, and Hunyuan) are used to play the roles of photovoltaic enterprises, power grid enterprises, and the government. Guided by designed prompts, each LLM independently reasons and outputs key factors influencing its core strategic choices under the new policy based on its role. Second, systematic statistics and integration of LLM responses screen out core influencing factors frequently mentioned and shared by different models. These factors form the basis for the game model's parameter system, avoiding subjectivity in traditional factor selection. Finally, based on these more "realistic" factors, a tripartite asymmetric evolutionary game model of photovoltaic enterprises, power grid enterprises, and the government is constructed, with replicator dynamics equations and equilibrium stability conditions derived. Python-based numerical simulation analyzes key parameter changes within a reasonable range to quantify how each factor affects their strategic evolution paths and stable equilibrium.
This paper proposes a methodological framework that combines multi‑LLM role‑playing with factor screening in policy evolutionary game analysis. Large language models are used to capture the heterogeneous cognition of different decision‑making agents, providing more realistic parameters for traditional game models and relaxing their strong assumptions. Using China's "Document No. 136" as a case, a tripartite evolutionary game model is built and validated with real data from photovoltaic enterprises. The results show how key policy variables, such as market‑driven electricity price fluctuations and subsidy withdrawal, dynamically affect the strategies of photovoltaic enterprises, grid enterprises, and governments, and identify the conditions under which stable outcomes emerge. Critical thresholds are also determined, including a lower bound for market electricity prices and an upper bound for innovation costs of new energy enterprises. The findings empirically confirm that subsidy removal and absorption responsibility mechanisms can promote market self‑regulation, offering governments a theoretical basis for targeted policy design and enterprises practical guidance for strategy optimization.
1 Construction of the Tripartite Evolutionary Game Model
1.1 Selection of Influencing Factors
This study integrates LLMs into influencing factors analysis, providing a novel policy research approach. The core reason why LLMs are applicable to such game-theoretic scenarios in electricity market policies lies in their alignment with the essential demands of policy gaming and their ability to effectively overcome the limitations of traditional methods. First, electricity market policy games involve multiple stakeholders including government, power generation enterprises, and grid enterprises, whose decisions are influenced by complex factors such as policy orientation, market conditions, and self-interests. Through role-playing, LLMs can capture the decision-making logic and behavioral preferences of different agents without requiring researchers to subjectively assume "representative agents", thereby enabling a more realistic simulation of the bounded-rational decision-making process among multiple stakeholders.Second, the dynamic nature of policy games demands that models adapt to the dynamic adjustment of stakeholders' strategies. Benefiting from strong contextual understanding and generation capabilities, LLMs can dynamically output decision responses of each agent that conform to realistic situations based on policy content, thus avoiding the problem of disconnection from reality caused by the strong assumptions embedded in traditional models.Third, for the specialized evaluation of new policies such as new energy electricity price reform, LLMs can rapidly identify key influencing factors from policy texts and market data to achieve objective factor screening. This effectively addresses the shortcoming of strong subjectivity in factor selection in traditional game models[28,31], providing more practically meaningful support for the accurate assessment of policy effects. Inspired by real-world human group decision-making heterogeneity, the four models simulate three subjects: photovoltaic enterprises, power grid enterprises, and government. Each role undergoes 5 independent tests to address potential response variations. The experimental design follows a structured protocol for consistency and repeatability.
1.1.1 The prompts provided to each LLM
We design a unified multiLLM roleplaying prompt for three decisionmaking agents: photovoltaic enterprises, power grid enterprises, and government agencies. All prompts follow the same setting: read Document No. 136, assume the scenario is after June 1, 2025, and roleplay as the corresponding Chinese stakeholder. For photovoltaic enterprises, the prompt asks for factors influencing the choice between active and passive grid connection; for power grid enterprises, it asks for factors affecting active or passive cooperation in new energy transmission and absorption; for government agencies, it asks for factors affecting strong or weak supervision. Each prompt requires an explanation and concludes with the fixed statement: "Final answer: I believe that … factors will affect my choice because …".
Although the prompt design in this paper takes policy background and role-playing as its core framework, the role-playing settings implicitly incorporate the micro decision-making constraints of each stakeholder: For photovoltaic generation enterprises, the prompt defines the role of "photovoltaic power generation enterprise", which implicitly reflects financial constraints such as investment costs and returns, as well as technical R&D bottlenecks. For power grid enterprises, the positioning of "responsible for new energy transmission and absorption" is specified, implying constraints including technical renovation pressure, accommodation capacity limitations, and regional industrial characteristics. For government, the role of "relevant government agencies" implicitly reflects realistic constraints such as market-oriented regulatory objectives, fiscal capacity, and regional disparities in new energy development. Meanwhile, by guiding each stakeholder to explain its decision-making logic within the policy context of Document 136, the micro-orientation of the prompt is further strengthened. This prevents excessively macro and homogeneous outputs from LLMs and ensures that the results conform to the actual decision-making logic of each participant.
1.1.2 LLM's subject role-playing process
1) Provide standardized prompts;
2) Record complete model responses;
3) Clear conversation history;
4) Repeat steps 1)-3), with a total of 5 independent tests conducted for each subject role;
5) Switch to the next subject role and repeat 1)-4) until the role-playing for all three subjects is completed;
6) Switch to the next LLM and repeat 1)-5).
It should be noted that conversation history is cleared before each new prompt to ensure test independence, with responses based solely on the current prompt. All responses are standardized. Default LLM temperature settings are retained for natural reasoning.
To enhance the reliability and economic rationality of influencing factors extracted by large language models, this paper adopts a multi-round semantic parsing framework. Rather than relying solely on high-frequency word screening, this study further conducts manual secondary validation and economic logic reduction on the model outputs, integrating theories of electricity market economics and practical experiences from China's new energy tariff market-oriented reforms. Semantic outputs irrelevant to the operational mechanism of the electricity market are excluded, and only critical factors consistent with cost-benefit theory, market equilibrium theory, and the institutional characteristics of China's electricity regulation are retained. During this process, policy text comparison, and industrial expert consultation are employed to ensure that the extracted factors reflect the actual decision-making logic following the 2025 new energy tariff market-oriented reform. These measures mitigate the impacts of the model's general corpus bias and algorithmic deviations, thereby guaranteeing the theoretical validity and practical applicability of factor selection.
Figure 1 summarizes key common factors frequently mentioned by models (per four LLMs) and their mention frequency across 15 independent tests per large model.
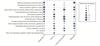 |
Fig. 1 Important influencing factors screened by the four LLMs |
Figure 1 shows that, despite differences in the factors identified after role-playing three subjects, the four large models have significant overlap in key factors. This confirms the feasibility and rationality of using LLMs to simulate different groups' basic decision-making and screening[28,31]. Sorting these more "realistic" LLM-identified factors gives those in Table 1.
Influencing factors
1.2 Basic Assumptions of the Model
This paper constructs a three-player evolutionary game model following the mainstream research paradigm in the field of evolutionary games. The model incorporates not only the innovation cost of photovoltaic enterprises and the renovation investment cost of power grid enterprises, but also multi-dimensional factors including market electricity price, subsidy, penalty, market access mechanism (market transaction on-grid electricity, mechanism quantity), and green certificate spillover value, etc.. All the above factors serve as incentive and restraint instruments under the market-oriented reform framework of "Document No. 136", and can comprehensively reflect the core government functions of "guidance, regulation and guarantee" in the policy, as well as the revenue composition of each stakeholder.
In the equilibrium analysis of evolutionary games, the linear return assumption is a general prerequisite that enables the analytical derivation of the replicator dynamics equations and the rigorous determination of strategy stability. From the theoretical logic of evolutionary games, the linear or nonlinear form of the cost function mainly affects the quantitative values of stakeholders' payoffs and the magnitudes of critical thresholds, without changing the sign of the fitness difference between strategies in the replicator dynamics equations. Therefore, it will not alter the evolutionary direction of the system or the qualitative conclusion of the evolutionarily stable strategy (ESS), nor will it impair the core robustness of the model results.
1.2.1 Participants in the game model
Game participants: photovoltaic enterprises, power grid enterprises, and government. All are boundedly rational, not fully grasping decision-making information, but adjusting strategies via trial and error and learning to maximize their interests.
1.2.2 Strategy choices
Following the standard modeling paradigm in the field of three-player evolutionary games, strategy options are: photovoltaic enterprises [active/passive grid-connection]; power grid enterprises [active/passive cooperation]; government [strong supervision/weak supervision]. The three parties achieve coordinated photovoltaic grid-connection via their choices. Assume photovoltaic enterprises choose active grid-connection with probability  , passive with
  ; power grid enterprises choose active cooperation with probability
  , passive with
  ; government chooses strong supervision with probability
  , weak supervision with
  ; where
  [0,1].
1.2.3 Costs and revenues of photovoltaic enterprises
1) If a photovoltaic enterprise chooses active grid-connection, it incurs innovation cost  . Assume that: generation efficiency improves, costs reduce, market demand is easier to forecast, and market bargaining power rises. If the grid enterprise actively cooperates, the photovoltaic enterprise gains generation revenue of
  . If it passively cooperates, the photovoltaic enterprise may face grid-connection restrictions due to poor absorption. Under such restrictions, the monthly on-grid electricity volume, equal to the mechanism-based electricity quantity, is
  , and the restricted generation revenue becomes
  . Here,
  denotes the average monthly on-grid electricity volume.
  does not participate in green certificate transactions, and no premium is considered;its price is solely determined by
  . The segment in market transactions can consider
  and depends on
  . Pursuant to "Document No. 136", new energy's
  and price
  shall be specified by provincial price, energy and power operation authorities. The document stipulates that mechanism-included electricity may be appropriately lower than total generation, implying
  and defining ratio
  =
=  (0<
(0< <1) as the proportion of mechanism-based electricity in actual on-grid quantity.
2) A photovoltaic enterprise choosing passive grid-connection faces grid-connection restrictions by grid enterprise and only gets restricted generation revenue  .
.
3) Government strong supervision provides a subsidy  for photovoltaic enterprises' on-grid electricity price; weak supervision means no subsidy.
1.2.4 Costs and revenues of power grid enterprises
1) Grid enterprises adopting active cooperation require grid upgrading costs  , assumed to absorb all on-grid electricity. If photovoltaic enterprises choose active grid-connection, grid enterprises gain transmission revenue
  (with
(with  as average transmission and distribution price) and, per "Document No. 136", price difference settlement fee
 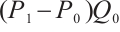 for mechanism-included electricity. For passive grid-connection by photovoltaic enterprises, grid enterprises earn transmission revenue
  and price difference settlement fee
 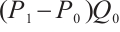 .
.
2) Grid enterprises adopting passive cooperation may face power absorption difficulties and on-grid quantity restrictions, with revenue limited to  (
( )
) ; if photovoltaic enterprises also choose passive grid-connection, unstable electricity access may incur additional grid operation and maintenance costs
  .
.
3) Government strong supervision imposes annual penalty  on grid enterprises adopting passive cooperation (e.g., missing renewable energy consumption share targets); weak supervision means no penalty.
1.2.5 Costs and revenues of government
1) Government revenue includes taxes from photovoltaic and grid enterprises at rates  and
and  respectively. Total tax revenue is
 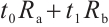 , with
  and
and  representing the profits of photovoltaic enterprise and power grid enterprises, respectively.
2) Regardless of government strategy, grid enterprises' passive cooperation damages government credibility, with assumed  .
.
3) Government strong supervision provides additional on-grid electricity price subsidy  to regional photovoltaic enterprises; if grid enterprises passively cooperate (e.g., missing renewable energy consumption share targets),
  is imposed.
4) Government weak supervision cancels subsidies to photovoltaic enterprises and  on grid enterprises for passive cooperation.
1.3 Establishment of the Game Payoff Matrix
Based on the above assumptions, a payoff matrix of the three-party evolutionary game subjects is constructed (Table 2).
Payoff matrix of three-party game subjects
1.4 Replication Dynamic Equations and Equilibrium Point Analysis
According to evolutionary game theory, the replication dynamic equations for photovoltaic enterprises, power grid enterprises, and government are constructed respectively.
The replication dynamic equation for photovoltaic enterprises is:
 (1)
(1)
The replication dynamic equation for power grid enterprises is:
 (2)
(2)
The replication dynamic equation for government is:
 (3)
(3)
By differentiating the above replication dynamic equations, we obtain:
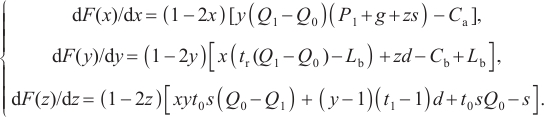 (4)
(4)
Letting  =
=  =
=  = 0, we can obtain 8 local stable equilibrium points, which are E1(0,0,0), E2(0,0,1), E3(0,1,0), E4(0,1,1), E5(1,0,0), E6(1,0,1), E7(1,1,0), and E8(1,1,1), respectively. According to evolutionary game theory, an ESS must satisfy the condition that all eigenvalues in the Jacobian matrix are negative.
Based on the above replication dynamic equations, the Jacobian matrix can be derived as Equation (5):
 (5)
(5)
Substituting the 8 local stable equilibrium points into Equation (5) respectively, the eigenvalues of the corresponding Jacobian matrix can be obtained (Table 3).
The analysis of eigenvalues in Table 3 indicates that three key conditions determine the evolutionary stability:1)  > 0 indicates positive net benefit for photovoltaic enterprises choosing active grid-connection; 2)
  > 0 means grid enterprises' net benefit from active cooperation (after transformation costs) exceeds that from passive cooperation; 3)
  > 0 reflects government revenue after tax adjustment exceeds subsidy expenditure. These three conditions (each >0 or not) yield 8 hypothetical scenario combinations (Table 4). After analyzing evolutionary game stable strategies, the results are presented in Table 5.
Table 5 shows distinct evolutionary equilibrium points across scenarios: Scenarios 1 and 3 have E8(1,1,1) with strategy (active grid-connection, active cooperation, strong supervision); Scenario 2 has E7(1,1,0) with (active grid-connection, active cooperation, weak supervision); Scenarios 5 and 7 have E4(0,1,1) with (passive grid-connection, active cooperation, strong supervision); Scenarios 6 and 8 have E3(0,1,0) with (passive grid-connection, active cooperation, weak supervision).
Eigenvalues of the Jacobian matrix
Eight different combinations of hypothetical scenarios
Analysis of local stability of equilibrium points
2 Parameter Assignment of Verification Case
This paper adopts actual data on photovoltaic industry in Jiangxi Province in 2024. Only the daily average market transaction electricity price ( ) is referenced from the 2024 Hubei Electricity Market White Paper, and the indicator values are generally consistent between the two provinces, reflecting the common characteristics of photovoltaic market electricity prices in central China. The initial values assigned to each parameter of the model are presented in Table 6. It should be noted that
  and
and  are eliminated during the evolution process, and initial values are no longer assigned to them.
It should be noted that: (a) Under the new market-oriented mechanism for on-grid electricity prices of new energy specified in "Document No. 136", electricity price subsidies for new energy have been basically eliminated, except for 74 special regions. Accordingly, the electricity price subsidy  adopted in this study is not a traditional high-intensity incentive subsidy, but a residual and symbolic average subsidy close to zero. The initial value of
  is 0.000 001 ten thousand yuan/MWh. (b) For core operational parameters, official local statistics of Jiangxi Province and announcements issued by power grid enterprises are adopted preferentially. For industrial standard and policy-related parameters, unified national norms and legal documents are applied to avoid inconsistencies caused by heterogeneous data sources. Meanwhile, this study focuses on the photovoltaic market in Central China, and the simulation results are mainly intended to provide policy references for central provinces, so as to further ensure regional applicability and persuasiveness.
Initial value assignment of parameters
3 Simulation Analysis and Verification
This paper uses Python for numerical simulation to analyze how key parameter variations affect the three subjects' strategy selection in the evolutionary game. The initial parameter settings of this simulation are shown in Table 6. It should be noted that: the initial values of the above parameters meet the conditions of Scenario 1 in Table 5; however, this simulation experiment will also examine the impact of fluctuations in the values of individual factors on the strategic choices of the three main bodies. Therefore, under the condition of fluctuations in certain parameters, conditions satisfying other cases may occur, and the correctness of the model will be verified one by one in this simulation.
Parameters  ,
,  ,
,  ,
,  are usually verified by government departments, with relatively stable values; moreover, there is a proportional relationship
  between
  and
and  . Thus, this simulation only discusses parameters such as
  ,
,  ,
,  ,
,  ,
,  ,
,  , which may have large value fluctuations and are closely related to the grid connection of photovoltaic energy.
3.1 Impact of Daily Average Market Transaction Electricity Price ( )
)
Under the market-oriented pricing mechanism for new energy grid connection, all energy sources affect market prices, so photovoltaic energy may face significant price fluctuations when entering the market. P1 takes 10 values in [0.001 0, 0.070 0] ten thousand yuan/MWh, with 100 replicator dynamics equation evolution results cyclically plotted over time (Fig. 2). The threshold of  is in [0.001 0, 0.008 7]; as
  rises within this range, the equilibrium shifts from ESS2(0,1,1) to ESS1(1,1,1), where ESS2 means passive grid connection by photovoltaic enterprises, detrimental to industry sustainability. When
  is below the threshold value, the model satisfies Scenario 5 in Table 5; on the contrary, it satisfies Scenario 1. Simulation shows: 1) Above the threshold, higher
  increases enterprises' expected profit, raising active grid-connection probability; below it, profit lags expenditure, favoring passive strategies. 2) Rising
  reduces power grid enterprises' active cooperation probability, as higher prices increase purchase costs, curbing enthusiasm and prompting preference for existing models to lower prices. However, it will still choose to active cooperation under the influence of photovoltaic enterprises and the government in the end. 3) As shown in Fig. 2, changes in the value of
  have a significantly weaker impact on the willingness of power grid enterprises than on that of photovoltaic enterprises. With price fluctuations, the government tends to supervise the settlement of new energy transaction price, guiding both enterprises to adopt active strategies and avoid the adverse impacts caused by market fluctuations.
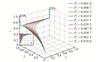 |
Fig. 2 Impact of different  (Note: the unit of |

3.2 Impact of Electricity Price Subsidy ( )
)
Under the policy background of "Document No. 136", which has substantially phased out subsidies, the subsidy  adopted in this paper is not a traditional high-intensity incentive subsidy, but a residual and symbolic average subsidy close to zero. Considering the price volatility in the photovoltaic market, we set
  at three levels: 0.006, 0.046 7, and 0.07 ten thousand yuan/MWh. For each level of
  , five values of
  within the interval [0.000 001,0.060 000] ten thousand yuan/MWh are selected. Simulation results of the replicator dynamic equations over 100 evolutionary iterations are plotted cyclically. As can be seen from Fig. 3, the evolutionary outcome converges to ESS2(0,1,1) only when
  = 0.006 and
  = 0.000 001, while all other scenarios converge to ESS1(1,1,1). In particular, when
  > 0.006 ten thousand yuan/MWh,
  exerts no significant influence on the evolutionary results, and the equilibrium point remains ESS1(1,1,1). This indicates that: When
  is excessively low, it will negatively affect the grid-connection decisions of photovoltaic enterprises, which is consistent with the conclusion in Section 3.1. When
  exceeds the threshold value, the strategic choices of the three stakeholders in central China (represented by Jiangxi) are insensitive to adjustments in
  . In this case, the model consistently conforms to Scenario 1 in Table 5, further validating the model's effectiveness. Simulation results: 1) The photovoltaic industry in central regions such as Jiangxi (medium-to-high penetration areas) has formed a relatively mature market-oriented profit model. Photovoltaic enterprises in these regions have now adapted to policies with reduced or even eliminated subsidies. Their revenue mainly derives from electricity market transactions, guaranteed power accommodation, and weak policy incentives, rather than traditional subsidies. Although a slight increase in s can raise the expected returns of PV enterprises, its share in total revenue has declined significantly. Even when s approaches zero, enterprises can still cover costs and achieve reasonable returns relying on market-based revenue, thus exhibiting weak sensitivity to subsidy changes. 2) Smaller
  strengthens power grid enterprises' active cooperation, as subsidy cancellation promotes energy competition fairness and their willingness to accept new energy grid-connection. 3) The smaller
  is, the weaker the government's supervisory tendency. Cancelling subsidies can also cut the government's fiscal burden, restrict the obstacles special subsidies create for the rational development of other energy forms, and facilitate the government's shift from a "direct intervenor" to a "rule-maker and supervisor".
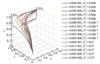 |
Fig. 3 Impact of different  and and  (Note: the unit of |


3.3 Impact of Annual Innovation Costs Invested by Photovoltaic Enterprises ( )
)
Annual innovation costs  take 10 values in [500,8 000] ten thousand yuan, with 100 replicator dynamics equation evolutions simulated and plotted cyclically over time. Figure 4 shows
  's threshold is 7 167-8 000 ten thousand yuan; as
  rises within this range, equilibrium shifts from ESS1(1,1,1) to ESS2(0,1,1), where ESS2 means photovoltaic enterprises choose passive grid-connection. When
  > 7 167, the model satisfies Scenario 5 in Table 5; on the contrary, it satisfies Scenario 1. Simulation shows: 1) Below the threshold, photovoltaic enterprises choose active grid-connection under other parties' influence, but their willingness to maintain the status quo grows with
  ; when
  exceeds the threshold, revenue fails to cover expenses, leading to passive grid-connection. 2) Higher
  increases power grid enterprises' active cooperation probability, as photovoltaic enterprises' innovations may improve price prediction and energy storage configuration, boosting photovoltaic energy's value to the grid and thus grid enterprises' cooperation willingness. 3) As shown in Fig. 4, changes in the value of
  have a significantly weaker impact on the willingness of power grid enterprises than on that of photovoltaic enterprises. To correctly guide the strategic choices and continuous innovation of photovoltaic enterprises, the government chooses to supervise photovoltaic enterprises' innovation cost investment.
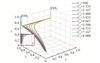 |
Fig. 4 Impact of different  (Note: the unit of |

Photovoltaic energy may face price fluctuations in market electricity transactions; examining only single innovation cost changes cannot reveal such fluctuations' impact on their innovation. Thus, under three market prices  = 0.02, 0.046 7, 0.07,
  take 3 values in [500, 7 000] ten thousand yuan respectively, with 100 replicator dynamics equation evolutions simulated and plotted cyclically over time for further analysis. Figure 5 shows: With the same
  , higher
  raises photovoltaic enterprises' active grid-connection likelihood; conversely, if
  remains depressed for a long time, the higher the probability that photovoltaic enterprises will choose the passive grid-connection strategy. This indicates that the higher the average market transaction price, the more motivated photovoltaic enterprises are to secure higher prices by optimizing energy storage, forecasting demand, and timing grid connections, thus gaining excess profits. The new market price settlement mechanism obviously incentivizes these enterprises to boost innovation.
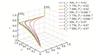 |
Fig. 5 The impact of different  and and  (Note: the unit of |


3.4 Impact of Mechanism-Based Electricity Quantity Proportion ( )
)
"Document No. 136" stipulates "mechanism-included electricity can be lower than total generation", so  <
< . Thus, by setting the proportion of mechanism electricity
  =
=  /
/ (0<
(0< <1), the impact of mechanism electricity and actual grid-connected electricity on the evolutionary results can be analyzed indirectly through this proportion.
  takes 10 values in [0.10, 0.95], with 100 replicator dynamics equation evolutions simulated and plotted cyclically over time. Figure 6 shows
  's threshold is 0.478-0.572; as
  drops from 0.572 to 0.478, equilibrium shifts from ESS1(1,1,1) to ESS2(1,1,0) (government "weak supervision"). When
  0.572, the model satisfies Scenario 2 in Table 5; on the contrary, it satisfies Scenario 1. Simulation results: higher
  reduces photovoltaic enterprises' active grid-connection willingness but raises power grid enterprises' "active cooperation" probability. Higher proportion means more
  and less market-transacted electricity (

 ): photovoltaic enterprises gain less from flexible transactions (lower enthusiasm), while grid enterprises face smaller price fluctuation risks (stronger cooperation willingness). However, "Document No. 136" emphasizes guiding new energy like photovoltaics in market transactions. Higher
  means lower photovoltaic market participation, prompting stronger government supervision. Figure 6 shows that when
  is higher than the threshold, the government will choose "strong supervision"; when
  further decreases, the government tends to choose "weak supervision". The government is highly sensitive to q.
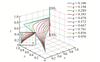 |
Fig. 6 Impact of different 
|
To sum up, the value of  does not affect the strategic choices of photovoltaic enterprises and power grid enterprises, but it does influence their willingness to choose. As shown in Fig. 6, changes in the value of q have a significantly weaker impact on the willingness of power grid enterprises than on that of photovoltaic enterprises. Meanwhile, a gradual decrease in
  indicates further stabilization of the power market transactions, reflecting the government's shift from a "direct intervener" to a "rule-maker and supervisor".
3.5 Impact of Green Certificate Spillover Value ( )
)
Green certificate spillover value  takes 10 values in [0.000 1, 0.100 0] ten thousand yuan/MWh, with 100 replicator dynamics equation iterations simulated and plotted cyclically over time. Figure 7 shows that
  does not affect the equilibrium point from always being ESS(1,1,1). In this case, the model consistently conforms to Scenario 1 in Table 5, further validating the model's effectiveness. Simulation results: 1) Higher
  boosts photovoltaic enterprises' expected market revenue, enhancing their participation willingness and active grid-connection probability. 2) Higher
  increases photovoltaic electricity in transactions, raising grid enterprises' absorption burden; they prefer the status quo, but still cooperate under others' influence. 3) As shown in Fig. 7, changes in the value of g exert roughly equivalent effects on the willingness of both photovoltaic enterprises and power grid enterprises. Government will monitor grid-connected electricity's green certificate value in transactions to ensure supply-demand stability.
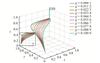 |
Fig. 7 Impact of different  (Note: the unit of |

This indicates that adjustment of  may not impact the final strategic choices of the three parties, but they significantly influence the intensity of choice willingness (between "passive selection" and "active preference") for photovoltaic enterprises and power grid enterprises.
3.6 Impact of Assessment penalties ( )
)
Annual penalties  take 10 values in [0, 20 000] ten thousand yuan, with 100 evolutions of the replicator dynamics equation simulated and plotted over time. Figure 8 shows d does not affect the equilibrium point from always being ESS(1,1,1). In this case, the model consistently conforms to Scenario 1 in Table 5, further validating the model's effectiveness. Simulation results: 1) Higher
  raises grid enterprises' active cooperation probability. 2) Higher
  reduces photovoltaic enterprises' active grid-connection probability; they may shift innovation responsibility to grid enterprises, lowering their own requirements but eventually choosing grid-connection under others' influence. 3) As shown in Fig. 8, changes in the value of
  have a significantly greater impact on the willingness of power grid enterprises than on that of photovoltaic enterprises. Meanwhile, a smaller penalty
  corresponds to a weaker regulatory tendency of the government, reflecting the trend in government regulatory strategy and its transition from a "direct intervener" to a "rule-maker and supervisor".
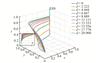 |
Fig. 8 Impact of different  (Note: the unit of |

This indicates that consumption responsibility assessment penalties may not influence the final choice of photovoltaic and power grid enterprises to adopt active grid connection strategies, but significantly impact their willingness intensity in strategy selection. Meanwhile, the reduction of assessment penalties reflects the government's role transition from a "direct intervenor" to a "rule maker and supervisor".
4 Conclusions and Suggestions
4.1 Conclusions
1) Photovoltaic enterprises are highly sensitive to electricity prices. Sustained electricity prices below the critical threshold will curb new energy investment in the central and western regions abundant in wind and solar resources yet with underdeveloped economies, calling for precautions against vicious competition featured by "bad money driving out good".
2) Full subsidy phase-out still brings transitional risks. While New energy industry in central China can sustain sound operation without substantial subsidies, such a situation cannot be replicated in the central and western regions plagued by high wind and solar curtailment.
3) Due to the nature of state-owned enterprises, grid enterprises prioritize administrative objectives over profit maximization in decision-making and generally choose cooperative strategies, with their willingness to cooperate subject to electricity prices fluctuations, subsidies and consumption assessment.
4) Limitations: Based on bounded rationality, this paper only analyzes Photovoltaic grid connection. Restricted by the public welfare attribute of electricity, the model assumes grid companies gain revenue merely from power transmission excluding end-user retail proceeds, which conforms to China's recent policy to set up independent power retailers serving end consumers. Future research can bring in demand-side participants and explore risk control strategies covering adjustable loads and energy storage to reduce industrial dependence on administrative measures.
4.2 Suggestions
Based on the conclusions of the evolutionary game discussed earlier, the following suggestions are put forward for the three levels of government, photovoltaic enterprises, and power grid enterprises:
1) Government level: (a) Under the market-oriented mechanism specified in "Document No. 136", photovoltaic generation enterprises in medium-to-high penetration regions of central China can maintain their willingness to actively connect to the grid without relying on substantial subsidies. Nevertheless, the regional disparities among China's provinces cannot be overlooked. Instead, policy implementation should take into account the characteristics of different regions, adopt appropriately flexible regulation, and apply policy tools in a differentiated manner. (b) Second, establish strategic thresholds to stabilize the market. Taking Jiangxi Province as an example, when the market transaction price of photovoltaic energy continues to be lower than 0.006 ten thousand yuan/MWh, the government should activate a temporary price intervention mechanism. It is advisable to set a ceiling for the innovation costs of photovoltaic generation enterprises (for example, with reference to RMB 7 167 ten thousand yuan), and the excess part may be eligible for additional pre-tax deductions for R&D expenses. In addition, the ratio  of supervisory mechanism electricity to grid-connected photovoltaic electricity may be monitored. When
  exceeds 0.572, the government should further strengthen the supervision and guidance of photovoltaic enterprises' participation in the market transactions.
2) Photovoltaic enterprises level: (a) To address market fluctuations, enterprises should enhance their ability to identify and capture trading opportunities through technological innovation. By investing an appropriate level of costs in innovation, they can achieve high returns from transactions executed during periods of elevated electricity prices. (b) Additionally, they should explore medium- and long-term contract opportunities with large industrial and commercial users to lock in long-term returns, so as to avoid the revenue risk arising from market electricity prices falling below  ≤ 0.006 ten thousand yuan/MWh. (c) Furthermore, enterprises can develop collaborative distributed energy models by building "photovoltaic+energy storage+microgrid" systems in industrial parks to enable partial on-site self-consumption, thereby alleviating operational pressure when electricity price
  fluctuates below the threshold. (d) Finally, active participation in the green certificate market can yield premium revenues and support long-term sustainability.
3) Grid level: Based on their state-owned attributes, a dual incentive and restraint mechanism that combines administrative goal orientation and reasonable return guarantee should be established. The assessment requirements for new energy accommodation shall be closely integrated with investment cost compensation. It is proposed that when power grid enterprises achieve the new energy accommodation targets, the government may provide special fiscal subsidies or additional deductions for investment costs. This not only strongly supports the institutional logic of "priority to state-owned attributes", but also prevents irrational expansion caused solely by assessment pressure. (b) State-owned grid enterprises should strengthen their social responsibilities. Their state-owned attributes determine that they must cooperate and undertake the administrative responsibilities of coordinating regional energy balance and removing barriers to new energy accommodation. They are also obliged to promote the implementation of policies for cross-provincial and cross-regional electricity transactions. Such responsibilities take precedence over the pursuit of profit maximization within individual regions.
1. 三峡大学 经济与管理学院, 湖北 宜昌 443002
2. 武汉商学院 人工智能与大数据学院, 湖北 武汉 430056
References
- Shan S, Genç S Y, Kamran H W, et al. Role of green technology innovation and renewable energy in carbon neutrality: A sustainable investigation from Turkey[J]. Journal of Environmental Management, 2021, 294: 113004. [Google Scholar]
- Xu T T, Kang C Y, Zhang H. China's efforts towards carbon neutrality: Does energy-saving and emission-reduction policy mitigate carbon emissions?[J]. Journal of Environmental Management, 2022, 316: 115286. [Google Scholar]
- Lin C, Shao S, Sun W, et al. Can the electricity price subsidy policy curb NOX emissions from China's coal-fired power industry? A difference-in-differences approach[J]. Journal of Environmental Management, 2021, 290: 112367. [Google Scholar]
- Ai Y. Research on the Reform of Feed-in Tariff Mechanism in China[D]. Beijing: North China Electric Power University, 2020(Ch). [Google Scholar]
- Zeng X. Reflection and perfection of market-oriented electricity price system of coal-fired power under the background of "double carbon"[J]. Guangdong Economy, 2023(5): 86-89(Ch). [Google Scholar]
- Fan B. Research of Electricity Price Regulation Method and Application[D]. Beijing: North China Electric Power University, 2010(Ch). [Google Scholar]
- Liu L Q. Where is the on-grid electricity price of power generation side going?[J]. China Power Enterprise Management, 2024(13): 83-85(Ch). [Google Scholar]
- Zhang X, Zhu Q Y, Li X C, et al. The impact of government subsidy on photovoltaic enterprises independent innovation based on the evolutionary game theory[J]. Energy, 2023, 285: 129385. [Google Scholar]
- Khan M N, Das S. Advancing traffic safety through the safe system approach: A systematic review[J]. Accident Analysis & Prevention, 2024, 199: 107518. [Google Scholar]
- He S Q, Hou Y R, Dong Z F, et al. The evolution of China's electricity market-oriented reform: Pathways to achieving marketization and decarbonization in response to climate policy[J]. Journal of Environmental Management, 2025, 389: 126103. [Google Scholar]
- Zhou Y, Shi Z Y, Wu L B. Green policy under the competitive electricity market: An agent-based model simulation in Shanghai[J]. Journal of Environmental Management, 2021, 299: 113501. [Google Scholar]
- Yuan J H, Zhang W R, Shen Q X, et al. The impact of electricity-carbon market coupling on system marginal clearing price and power supply cost[J]. Environmental Science and Pollution Research, 2023, 30(35): 84725-84741. [Google Scholar]
- Zheng X M, Wu C K, He S J. Impacts of market segmentation on the over-capacity of the thermal electricity generation industry in China[J]. Journal of Environmental Management, 2021, 279: 111761. [Google Scholar]
- Biró B, Aszódi A. Investigating the role of nuclear power and battery storage in Hungary's energy transition using hourly resolution electricity market simulations[J]. Heliyon, 2024, 10(9): e29841. [Google Scholar]
- Ye H F, Peng H W, Li C H, et al. A demonstration concentrating solar power plant in China: Carbon neutrality, energy renewability and policy perspectives[J]. Journal of Environmental Management, 2023, 328: 117003. [Google Scholar]
- Chen J L, Qing J, Cai Q R. Impact of bi-directional electric vehicle and demand response on residential distributed PV capacity planning based on TOU pricing[J]. Journal of Environmental Management, 2024, 356: 120689. [Google Scholar]
- Chen W, Luo W, Liang K R, et al. Research on new energy investment strategies based on noncooperative-cooperative biform game[J]. Journal of Systems Science and Mathematical Sciences, 2024, 44(12): 3557-3572(Ch). [Google Scholar]
- Wang X, Wang S C, Zhang S H. Game analysis of coupled electricity-carbon-green certificate markets with strategic bidding of renewable generators[J]. Power System Technology, 2024, 48(10): 4125-4138(Ch). [Google Scholar]
- Yang K, Liu T, Bai L, et al. Optimal configuration strategy of shared energy storage capacity for micro-grid cluster based on multi-party bargaining game[J]. Electrical Measurement & Instrumentation, 2024, 61(3): 33-41(Ch). [Google Scholar]
- Liu C X. Development opportunities and challenges brought by the market-oriented reform of new energy on-grid tariffs[J]. Wind Energy, 2025(3): 70-76(Ch). [Google Scholar]
- Mi F L. Reflections on the market-oriented reform of new energy on-grid electricity price[J]. China Power Enterprise Management, 2025(9): 12-15(Ch). [Google Scholar]
- Wang M, Hao Y, Qiu C, et al. Development direction and countermeasures of new energy under the background of market-oriented reform[J]. Water Power, 2025, 51(7): 1-6(Ch). [Google Scholar]
- Zhao B B, Chen Q Y. What impact will the market-oriented reform of new energy grid-connected electricity prices have[EB/OL]. [2025-05-17]. https://doi.org/10.28719/n.cnki.nshzj.2025.002485(Ch). [Google Scholar]
- Su Y B. Multi-agent evolutionary game in the recycling utilization of construction waste[J]. Science of the Total Environment, 2020, 738: 139826. [Google Scholar]
- Zhang W, Liu H. Evolutionary game analysis of multi-agent cooperation strategy analysis in agricultural water conservancy PPP project under digitization background[J]. Scientific Reports, 2024, 14: 22915. [Google Scholar]
- Xu Z, Zheng S D. An evolutionary game-theoretic analysis of the "multi-agent co-governance" system of unfair competition on Internet platforms[J]. PLoS One, 2024, 19(6): e0304445. [Google Scholar]
- Shi Q N, Yang S M, Wang N, et al. An evolutionary game-based simulation study of a multi-agent governance system for smart senior care services in China[J]. BMC Geriatrics, 2023, 23(1): 871. [Google Scholar]
- Hao Y Z, Xie D Y. A multi-LLM-agent-based framework for economic and public policy analysis[EB/OL]. [2025-02-24]. https://doi.org/10.48550/arXiv.2502.16879. [Google Scholar]
- Ma J. Can machines think like humans: A behavioral evaluation of LLM-agents in dictator games[EB/OL]. [2025-11-17]. https://doi.org/10.48550/arXiv.2410.21359. [Google Scholar]
- Mei Q Z, Xie Y T, Yuan W, et al. A Turing test of whether AI chatbots are behaviorally similar to humans[J]. Proceedings of the National Academy of Sciences of the United States of America, 2024, 121(9): e2313925121. [Google Scholar]
- Xie Y T, Liu Y Y, Ma Z, et al. How different AI chatbots behave benchmarking large language models in behavioral economics games[EB/OL]. [2024-12-16]. https://doi.org/10.48550/arXiv.2412.12362. [Google Scholar]
- Szabo L, Moner- Girona M, Jäger-Waldau A, et al. Impacts of large-scale deployment of vertical bifacial photovoltaics on European electricity market dynamics[J]. Nature Communications, 2024, 15: 6681. [Google Scholar]
- Zhu Z X, Jiang T L, Ali M, et al. Rechargeable batteries for grid scale energy storage[J]. Chemical Reviews, 2022, 122(22): 16610-16751. [Google Scholar]
- Paiano A, Lagioia G, Ingrao C. A combined assessment of the energy, economic and environmental performance of a photovoltaic system in the Italian context[J]. Science of the Total Environment, 2023, 866: 161329. [Google Scholar]
- Castillo-Díaz F J, Belmonte-Ureña L J, Abad-Segura E, et al. Perception of photovoltaic energy consumption in the Spanish primary sector. An environmentally profitable alternative[J]. Journal of Environmental Management, 2024, 357: 120840. [Google Scholar]
- Liu Q N. Study on Improvement of Cost Control for Power Grid Renovation Incity A[D]. Changsha: Hunan University, 2022(Ch). [Google Scholar]
- Gu B, Li X R. Innovative practice of power grid cost control with standard cost as the core: Taking G power grid company as an example[J]. Friends of Accounting, 2022(2): 114-119(Ch). [Google Scholar]
- Li X Z. Analysis of measures to improve the quality of distribution network operation and maintenance[J]. Integrated Circuit Applications, 2024, 41(8): 374-375(Ch). [Google Scholar]
- Wang Y L, Wang S, Zheng Y, et al. Calculation and allocation of operation and maintenance cost of power grid project based on elastic net[J]. Automation of Electric Power Systems, 2020, 44(20): 165-172(Ch). [Google Scholar]
- Yan X F, Mathematical model-based analysis of distribution metwork operation and maintenance costs[J]. Modern Industrial Economy and Informationization, 2024, 14(11): 41-43Ch). [Google Scholar]
- Pang X. Empowering social science research with artificial intelligence: Generative agents, complex causal analysis, and human-machine collaboration[J]. World Economics and Politics, 2024(7): 3-30(Ch). [Google Scholar]
All Tables
All Figures
|
Fig. 1 Important influencing factors screened by the four LLMs |
| In the text | |
|
Fig. 2 Impact of different (Note: the unit of |
| In the text | |
|
Fig. 3 Impact of different and (Note: the unit of |
| In the text | |
|
Fig. 4 Impact of different (Note: the unit of |
| In the text | |
|
Fig. 5 The impact of different and (Note: the unit of |
| In the text | |
|
Fig. 6 Impact of different
|
| In the text | |
|
Fig. 7 Impact of different (Note: the unit of |
| In the text | |
|
Fig. 8 Impact of different (Note: the unit of |
| In the text | |
Current usage metrics show cumulative count of Article Views (full-text article views including HTML views, PDF and ePub downloads, according to the available data) and Abstracts Views on Vision4Press platform.
Data correspond to usage on the plateform after 2015. The current usage metrics is available 48-96 hours after online publication and is updated daily on week days.
Initial download of the metrics may take a while.