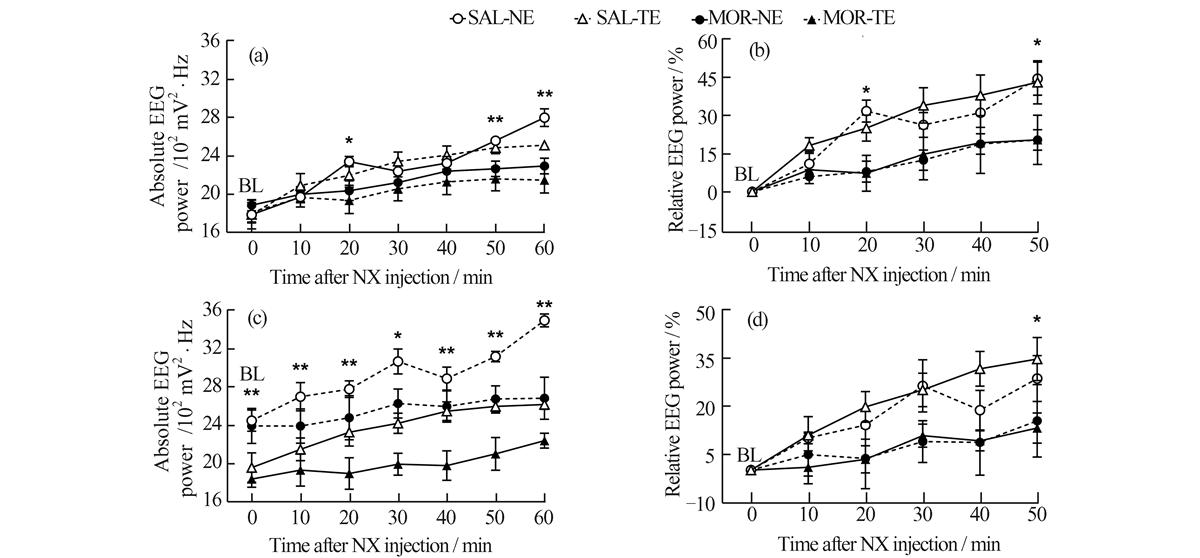
Fig. 3
Effect of different extinction treatments and naloxone on the total EEG power in mouse dorsal and ventral hippocampus
Download original image
(a) Absolute lineal power from DH; (b) Relative lineal power from DH; (c) Absolute lineal power from VH; (d) Relative lineal power from VH; * P < 0.05, ** P < 0.01 (ANOVA, significant difference between groups at the same phases after NX injection); BL: baseline
Current usage metrics show cumulative count of Article Views (full-text article views including HTML views, PDF and ePub downloads, according to the available data) and Abstracts Views on Vision4Press platform.
Data correspond to usage on the plateform after 2015. The current usage metrics is available 48-96 hours after online publication and is updated daily on week days.
Initial download of the metrics may take a while.