| Issue |
Wuhan Univ. J. Nat. Sci.
Volume 27, Number 3, June 2022
|
|
|---|---|---|
| Page(s) | 265 - 272 | |
| DOI | https://doi.org/10.1051/wujns/2022273265 | |
| Published online | 24 August 2022 | |
Biomedicine
CLC number: Q42
Effects of Different Extinction for Morphine-CPP on Hippocampal EEG Power Spectrum in Mice
1
School of Life Sciences, Yunnan Normal University, Kunming
650500, Yunnan, China
2
School of Ecology and Environmental Science, Yunnan University, Kunming
650500, Yunnan, China
† To whom correspondence should be addressed. E-mail: This email address is being protected from spambots. You need JavaScript enabled to view it.
; This email address is being protected from spambots. You need JavaScript enabled to view it.
Received:
8
March
2022
Abstract
The relationship between hippocampal electroencephalogram (EEG) power spectrum and the extinction of addiction memory was investigated. Forty KM mice (Kunming mice) that had successfully established morphine (MOR)-conditioned place preference (CPP) were divided into four groups: saline-training extinction (SAL-TE), SAL-natural extinction (SAL-NE), MOR-TE, MOR-NE, for extinction treatment and EEG recording in the dorsal and ventral hippocampus (DH/VH). Results show that the CPP score of MOR-TE significantly decreased and the total, β and γ bands power spectrum of MOR-TE was suppressed. Notably, the total power from the VH was more correlated with the extinction method, and the TE total power was always lower than NE in SAL or MOR group. Naloxone enhanced the EEG total power and all bands (DH) or β and γ bands (VH) power in the SAL group. However, in the MOR-TE group, only β and γ bands power in VH increased (P<0.05). The results suggest that TE can promote the extinction of opiate addictive memory more effectively than NE, and the extinction of MOR-CPP may have a stronger correlation with changes of VH-EEG power spectrum.
Key words: morphine / naloxone / conditioned place preference / hippocampus / electroencephalogram (EEG) power spectrum
These authors contributed equally to this work
Biography: LI Chunchun, female, Master, research direction: neurobiology. E-mail: This email address is being protected from spambots. You need JavaScript enabled to view it.
Foundation item: Supported by the National Natural Science Foundation of China (31760278) and NHC Key Laboratory of Drug Addiction Medicine of Kunming Medical University (2020DAMOP-002)
© Wuhan University 2022
 This is an Open Access article distributed under the terms of the Creative Commons Attribution License (https://creativecommons.org/licenses/by/4.0), which permits unrestricted use, distribution, and reproduction in any medium, provided the original work is properly cited.
0 Introduction
It is claimed that morphine (MOR), an opioid analgesic commonly used in clinical practice, can cause tolerance and even addiction when used for a long time. Addiction includes physical addiction and psychological addiction, the latter of which is more difficult to overcome[1, 2]. It is recognized that the essence of psychological addiction is abnormal and stubborn pathological memory, which is currently called "addiction memory", and it shares a similar neurobiological mechanism with normal learning and memory[1, 2]. The hippocampus is a key brain area for learning and memory, and it has direct circuitry and functional connections with the ventral tegmental area, the nucleus accumbens, and other addiction-related brain areas[2, 3]. Therefore, the hippocampus is also involved in opioid addiction at the genetic, molecular, cellular, synaptic plasticity, and neural circuit levels[1, 2, 4-7].
In previous studies, both acute and chronic administration of MOR have been found to affect the θ or γ power or the frequency of central gravity in the hippocampal electroencephalogram (EEG) power spectrum, but the effects are completely opposite[8, 9]. There was no significant change of EEG power in the dorsal hippocampus (DH) of MOR addicted rats, and the θ or γ bands of the rats decreased after treatment with the opioid receptor antagonist naloxone (NX), suggesting that the changes in the EEG power spectrum may be related to the formation of MOR addicted memories[7]. However, the performance of EEG power spectrum in the extinction of MOR addiction memory has not been reported. The hippocampus is divided into the dorsal hippocampus (DH) and the ventral hippocampus (VH), and have significant differences in terms of circuits and functional characteristics[10]. Hence, in this study, we establish a mouse model of MOR-conditioned place preference (CPP) to explore the EEG power spectrum of DH and VH and the NX processing effect after MOR memory extinction, so as to provide experimental evidence for the research on the neuroelectrophysiological mechanism of opioid addiction withdrawal regulation.
1 Materials and Methods
1.1 Animals
Sixty KM mice (Kunming mice, 30 males) were purchased from Changsheng Biotechnology, Shenyang, China [License: SCXK (Liao) 2015-1]. They were 6 weeks old and 42(±4) g in weight at the beginning of the experiment. The humidity was about 55(±5)%, the temperature was controlled at 22(± 2) ℃, and the light and dark alternated on a 12 h/12 h cycle in the animal room. Animals were kept in groups and their feeding was ad libitum. Before the experiment, the animals adapted to the laboratory room for 1 week, and were gently grasped and touched several times a day to reduce the stress response. The complete experimental process is shown in Fig. 1. All the animal experimental procedures were carried out in accordance with the regulations of Yunnan Province, and were approved by the Biomedical Ethics Committee of Yunnan Normal University.
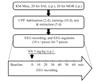 |
Fig. 1 Timeline of behavioral and EEG experiments after different extinction treatments on the morphine-CPP mice CPP: conditioned place preference; SAL: saline; MOR: morphine; TE: training extinction; NE: natural extinction; NX: naloxone |
1.2 CPP Training
The Acrylic CPP instrument was composed of three boxes (left, middle and right). There were two doors between the three boxes. The left box had inclined stripes and a smooth bottom, and the right box had gray dots and a rough bottom[11]. After each trial, the boxes were wiped with 70% alcohol to eliminate odor interference. The experiment started at 9:00 a.m. every day. The CPP experiment included four stages: habituation, screening, training, and testing, as detailed in Ref.[11]. The time the mice spent in each of the three boxes in a 15 min period was recorded by an animal behavioral video capture system. Each mouse adapted to the CPP procedures once a day for 2 d. The animals with time differences of ≤200 s between the left and right box were selected for the formal experiment.
The selected mice were then divided into MOR group and SAL group, half male and half female. The side with short staying time was the MOR-paired box. The drugs were administered alternately at 24 h intervals (morphine hydrochloride, Shenyang First Pharmaceutical, Shenyang, China) with the dosage increasing (10 mg/kg, 15 mg/kg, 20 mg/kg, 25 mg/kg, and 30 mg/kg) and the same volumes of saline (SAL) for 10 d. Then, the CPP behaviors were tested (Test 1) in the same way as in the habituation. The staying time in the MOR-paired box (T MOR) and non-paired box (T NON) was recorded. The CPP score = T MOR/(T MOR+T NON)×100%.
The mice with better CPP scores (≥60%) were selected and divided into training extinction (TE) groups and natural extinction (NE) groups (SAL-NE, SAL-TE, MOR-NE and MOR-TE groups, all n = 10, half female) which both received extinction treatment for 5 d. In the TE groups, the animals were placed in the MOR-paired box after SAL injection, and the other operations were consistent with the training period. The test was performed 6 h after the training, once a day. In the NE groups, after MOR-CPP was established, the animals were only injected with SAL and returned to their home cage, and the test phase was repeated 5 d later (Test 2).
1.3 Surgery and EEG Recording
When the CPP experiment was completed, the mice were fixed to the brain stereotaxic instrument under anesthesia (pentobarbital sodium, 60 mg/kg, i.p.). After skin preparation, local anesthesia, and skull exposure, two insulated stainless steel recording electrodes (Φ150 μm, bare tip 300 μm), were inserted into the target brain areas, with the reference electrode above the olfactory bulb. According to a stereotaxic brain atlas[12], the coordinates of recording electrode (unit: mm) were determined with the bregma as coordinate origin [DH: AP-(2.1-2.4), midline(ML) ± 1.5, DV-(1.8-2.0); VH: AP-3.5, ML±(3.2-3.3), DV-4.2]. The EEG signals were recorded by a physiological signal acquisition system (Chengdu Instrument Factory, Chengdu, China). After the signal had stabilized for 10 min (baseline), injected NX (5 mg/kg, i.p), and then recorded for 60 min continuously. EEG data (10 s) were collected from each 10 min segment for analysis. The EEG time series data were transformed into power spectrum data by filtering and fast Fourier transform, and the total power (1-100 Hz), relative total power and the power of six frequency bands (δ (1-4 Hz), θ (4-8 Hz), α (8-12 Hz), β (12-30 Hz), γ1 (30-45 Hz) and γ2 (55-100 Hz) were calculated. Relative power = (absolute power-baseline power)/baseline power×100 %.
1.4 Histology
After the EEG recording, an anode current (DC, 6 V, 10 s) was applied to the target areas via the recording electrodes. Then the animals were sacrificed by overdose anesthetization and perfused with SAL, and fixed with formaldehyde solution (4%, containing 1% potassium ferrocyanide) via the aorta ascendens. The brain was removed and fixed for at least 7 d, and the electrode position was examined by vibrating section (100 μm) and cresyl violet staining.
1.5 Data Analysis
All the data were shown as mean ± standard error of mean (SEM). Paired sample t test was used for intra-group data comparison, and independent sample t test was used for inter-group data comparison. One-way analysis of variance (ANOVA) with multiple comparisons was used for comparison between groups. Two-factor data for time and extinction/NX treatment were compared using repeated measures of two-way analysis of variance (general linear model with repeated measure, GLM-RM). The statistical results were considered statistically significant at P < 0.05.
2 Results
2.1 Histology and CPP Behaviors
The electrode position was shown in Fig. 2(a). Histological examination showed that the electrode position from 8 animals was wrong, and their EEG data were excluded. There was no significant gender difference in CPP scores (independent sample t test, T 30 = 0.987, P =0.332). Therefore, in the following text, gender is no longer differentiated for discussion. Paired sample t test showed that, after 10 d of training, the CPP scores did not change significantly from the baseline in the SAL group (T 15 = 0.820, P = 0.425). But in the MOR group, there was a significant increase compared with its baseline or the SAL group (paired or independent sample t test, both P = 0.000), indicating that the MOR-CPP mouse model was successfully established (Fig. 2(b) and (c)).
 |
Fig. 2 Effects of different extinction treaments on the MOR-CPP scores in mice (a) Photos of the position of the recording electrode tips (coronal slices with cresyl violet staining); (b) training extinction; (c) natural extinction; The arrows indicated the target area in the dorsal or ventral hippocampus; * P < 0.05, ** P < 0.01 (independent-sample t test, vs. SAL); # P < 0.05, ## P < 0.01 (paired-sample t test, vs. baseline) |
From the perspective of extinction method, the CPP score of NE group was still higher than the baseline after 5 d of NE treatment (paired sample t test: T 7 = -1.655, P = 0.000), indicating that NE could not cause the complete extinction of MOR-CPP (Fig. 2(c)). However, with the increase of extinction days, the CPP score in the TE group decreased gradually and reached the baseline level after 5 d of training (T 7 = -0.129, P = 0.901 vs. baseline), which was also lower than that in the NE group (independent sample t test, T 14 = 4.259, P = 0.000), suggesting that TE treatment could effectively promote the extinction of MOR-CPP (Fig. 2(b)).
2.2 Total EEG Power
Effects of different extinction treatments and naloxone on the total EEG power in mouse DH and VH are shown in Fig. 3.
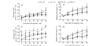 |
Fig. 3 Effect of different extinction treatments and naloxone on the total EEG power in mouse dorsal and ventral hippocampus (a) Absolute lineal power from DH; (b) Relative lineal power from DH; (c) Absolute lineal power from VH; (d) Relative lineal power from VH; * P < 0.05, ** P < 0.01 (ANOVA, significant difference between groups at the same phases after NX injection); BL: baseline |
As shown in Fig. 3(a) and (c), ANOVA showed that the baseline level of total power of DH-EEG was similar among all groups (F 3,20 = 0.339, P = 0.798), while the baseline level VH-EEG was different between groups (F 3,20 = 6.848, P = 0.000). Multiple comparisons showed that the difference was mainly affected by extinction methods (NE vs. TE, both P ≤ 0.05; SAL vs. MOR, both P ≥ 0.564). GLM-RM analysis showed that the absolute total power of hippocampal EEG had a time main effect (P = 0.000 for both), suggesting that the total power of EEG in both brain regions increased significantly with time after NX treatment. The time × drug interaction effect was significant (all P ≤ 0.005), suggesting that MOR treatment reduced the growth rate of total EEG power in both brain regions (compared with SAL). The interaction effect of time × extinction was different (DH: F 2.584, 51.670 = 3.320, P = 0.033; VH: F 4.036, 80.727 = 1.230, P = 0.305), which indicated that the increase of total DH-EEG power after NX injection was related to both MOR/SAL treatment and extinction methods, while the increase of VH-EEG was only affected by MOR treatment. GLM-RM analysis showed that the DH-EEG total power between groups was mainly affected by drugs (F 1, 20 = 6.795, P = 0.017) rather than the extinction methods (F 1, 20 = 0.183, P = 0.674); the VH-EEG total power was influenced by the drug and the extinction methods (all F 1,20 ≥ 9.948, P ≤ 0.005). If drug × extinction factors were combined, the difference between the two groups disappeared (F 1, 20 =0.268, P = 0.610), suggesting that drug and extinction method were independent influencing factors.
As shown in Fig. 3(b) and (d), the relative total power excludes the baseline difference. GLM-RM analysis showed that the relative total power of hippocampal EEG was similar to the absolute total power, and there was a time main effect (both P = 0.000), suggesting that the total power of EEG in both brain regions increased significantly with time after NX injection. Different time × drug interaction effects (DH: F 2.480, 31.195 = 5.266, P = 0.006; VH: F 5, 80 = 1.485, P = 0.204) suggest that MOR treatment reduced the growth rate of DH-EEG relative total power, but had nothing to do with the growth rate of VH.
The interaction effect of time × extinction was not significant (all P ≥ 0.132), which showed that the relative total power of EEG in the two brain regions was not affected by extinction methods after NX injection. GLM between groups effects showed that the relative total power of EEG in the two brain regions was mainly caused by MOR treatment (all P ≤ 0.011), while the extinction methods had no significant effect (all P ≥ 0.968).
2.3 EEG Power Spectrum
As shown in Fig. 4, the VH powers of θ, β, γ1 and γ2 were higher than DH powers in SAL-NE or SAL-TE, indicating the different EEG power of the two hippocampal regions in normal mice. Although the total EEG power levels of SAL and MOR were similar, the VH baseline power of γ2 from MOR-TE was higher than that of SAL-TE, while the power of β, γ1 and γ2 from MOR-NE was lower than that of SAL-NE (multiple comparisons, all P < 0.05; Fig. 4(b)). Compared with the NE treatment, the VH power of β, γ1, γ2 (SAL-TE) and γ1 (MOR-TE) was depressed in TE groups (multiple comparisons, P<0.05), suggesting that the lower total power of VH-TE at baseline was mainly caused by the depression of the power of β and γ bands.
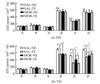 |
Fig. 4 Effect of extinction treatments on the hippocampal EEG power spectrum (baseline) in mice Independent sample t test: * P < 0.05, ** P < 0.01 vs. SAL; # P < 0.05, ## P < 0.01 vs. NE; paired sample t test: & P < 0.05, && P < 0.01 vs. VH |
After NX injection, the β, γ1, and γ2 powers of DH and VH in the SAL group increased over time compared with their baseline in both TE and NE treatment (paired sample t test, all P ≤ 0.05), and the δ, θ, and α powers of SAL-DH also increased (all P < 0.05, Fig. 5). In the MOR group, power at most frequency bands had no significant change from baseline (P > 0.05, Fig. 5), except that DH-δ (60 min) and VH-θ (40 min), β (30-60 min) and γ2 (10-40 min, 60 min) were increased by NE treatment (all P < 0.05).
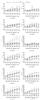 |
Fig. 5 The hippocampal EEG power spectrum changing (Δ/%) after naloxone treatment in mice BL: baseline; One-way ANOVA: * P < 0.05, ** P < 0.01 |
In terms of extinction method, the α power of DH/VH treated by SAL-NE after NX injection (DH: 20-60 min; VH: 20-40 min) was higher than that in TE group, but not in MOR group (multiple comparisons: P < 0.05). In addition, the power of some frequency bands (δ: SAL, 60 min, β: MOR, 50 min and γ2: SAL/MOR, 60 min) of DH-NE was higher than that of TE. The power of θ (MOR: 40-60 min), β (SAL/MOR: 30-60 min), γ1 (SAL/MOR: 10-60 min) and γ2 (SAL/MOR: 20-60 min) of VH-NE also increased with time (P < 0.05).
3 Discussion
According to Pavlovian conditioning theory, CPP experiments are used to measure the degree of psychological addiction of animals to reward substances under certain circumstances[13]. In this study, the CPP scores of KM mice were significantly higher than those of SAL group and its own baseline after 10 d of treatment with MOR by increasing the dose of MOR every other day, indicating that the establishment of MOR-CPP was successful. On this basis, the effects of TE and NE were detected, and the results showed that, after 5 d of treatment, the CPP scores of the TE group had dropped to the baseline level, while the CPP scores of the NE group were still high (see Fig. 2(b) and (c)). This result is similar to the results obtained from research on mice of Ref.[14], and rats by using constant doses (10 mg/kg) for CPP modeling and TE treatment[15-17], proving that TE treatment can completely extinguish MOR-CPP in a shorter time than NE treatment.
EEG power spectrum is widely used to study the functional state of the brain. Previous studies using wireless telemetry have found that the context of the drug-paired box during the extinction period of opioid CPP was accompanied by the decrease of δ+θ power of the nucleus accumbens shell region and the increase of β power[18], as well as the decrease of θ power in the prefrontal infralimbic area[19]. Studies have also shown that chronic MOR treatment can increase DH-θ and γ power in mice and rats[8, 9]. The total power of DH-EEG and the δ, θ and α bands power of rats with established MOR-CPP showed an increasing trend[7]. In this study, it was found that the total power of DH-EEG of MOR-CPP animals was similar to that of SAL group, regardless of TE or NE treatment, after 5 days of extinction treatment (Fig. 3(a)), which was the same as that of other brain regions in the extinction phase and DH in the non-extinction phase. However, the total power of VH-EEG in TE treatment was significantly lower than that in NE treatment (in SAL group or MOR group, Fig. 3(c)), suggesting that the change of total power of VH-EEG was mainly related to the extinction method, rather than MOR drug, and TE treatment could selectively reduce the total power of VH-EEG.
Power spectrum analysis showed that the baseline power of γ1, γ2 and β in SAL-VH area was decreased by TE treatment compared with NE treatment. The baseline power of β, γ1 and γ2 in MOR-VH treated by NE was lower than that in SAL group. It is worth noting that the baseline γ2 power of MOR-VH treated by TE was higher than that of SAL, while only γ1 power of MOR-VH treated by NE was higher than that of TE (Fig. 4). These results indicate that MOR, NE and TE treatments have different effects on the EEG power spectrum of the hippocampus (DH or VH), and mainly affect the β and γ bands of VH. The VH-EEG power spectrum was better than DH to reflect the behavioral changes of MOR-CPP extinction. However, although TE can promote the extinction of MOR-CPP, the hippocampal EEG of animals with MOR addiction extinction is still different from that of normal animals, which may be related to the relapse of drug addiction. As an important brain region associated with cognitive function, hippocampus EEG-θ, γ and θ-γ co-oscillations are closely associated with cognitive functions such as learning and memory and MOR addiction memory[7, 20, 21]. DH and VH differ greatly in development, anatomy, circuitry, molecular characteristics, synaptic plasticity, and function[10, 22]. Although both are involved in the memory process of MOR addiction, several studies in recent years have suggested that VH plays an important role in the mechanisms of nicotine[22], cocaine[23] and opioid addiction[6, 7, 11, 24]. The present study further proved that the change of VH-β and γ band power is directly related to the extinction of opioid addiction and the extinction method.
Opioid receptor antagonist NX can stimulate the central nervous system, promote arousal and recovery of consciousness, and is mainly used for opioid detoxification first aid and relapse prevention in clinical settings[25]. In this study, it was found that NX injection could increase the total power of EEG in DH and VH in SAL mice and its multiple power spectrum components, especially the high-frequency fast wave power (such as β, γ1 and γ2), which is similar to previous reports[26]. However, the EEG power of MOR mice did not increase significantly, and was lower than that of SAL group. The θ, β and γ2 power of MOR-VH treated with NE only increased (Fig. 4). The increased power of high-frequency fast waves, such as β and γ, indicates that the animals' cerebral cortex activity is more desynchronized, suggesting that NX does play a role in promoting arousal. On the one hand, the significant difference in EEG power spectrum between the MOR-CPP extinct mice and the SAL group indicates that MOR addiction has a profound effect on hippocampal function, and this effect is difficult to eliminate by extinction treatment only for a few days. This may be related to the damage of gene expression and molecules, and plasticity of neurons caused by opioid addiction[27-30]. On the other hand, since the MOR-CPP of NE treated animals did not actually extinguish to the baseline level during EEG recording and still had a higher CPP score, the difference in VH-EEG power spectrum between TE and NE treatment may only reflect the degree of hippocampal CPP memory extinction.
4 Conclusion
This study firstly found that the total power and power spectrum of dorsal hippocampal EEG of MOR-CPP extinction mice are similar to those of normal mice, but the correlation between the power spectrum of ventral hippocampal EEG, especially the power of β and γ bands, and the extinction methods are higher. Opioid receptor antagonist NX can improve the total EEG power and β and γ frequencies of DH-VH in normal animals, but the effect of promoting the EEG power of MOR-CPP extinction animals is limited. The role of the hippocampus in opioid addiction-extinction and the mechanism of opioid receptors remain to be further investigated.
Acknowledgments
We are grateful to FU Zhichao, WANG Xia, LIU Yingqing, YAO Linghong, and ZHOU Ying from the Yunnan Normal University for their assistance in animal behavioral experiment.
References
- Nestler E J, Luscher C. The molecular basis of drug addiction: Linking epigenetic to synaptic and circuit mechanisms [J]. Neuron, 2019, 102(1): 48-59. [CrossRef] [PubMed] [Google Scholar]
- Li P, Wang X Q, Sun Z W, et al. Advances in the study of drug addiction memory and its neural circuits [J]. Journal of Biology, 2018, 35(1): 93-96, 100(Ch). [Google Scholar]
- Peters J, Kalivas P W, Quirk G J. Extinction circuits for fear and addiction overlap in prefrontal cortex [J]. Learning & Memory, 2009, 16(5): 279-288. [CrossRef] [PubMed] [Google Scholar]
- Famitafreshi H, Karimian M. Socialization alleviates burden of oxidative-stress in hippocampus and prefrontal cortex in morphine addiction period in male rats [J]. Current Molecular Pharmacology, 2018, 11(3): 254-259. [CrossRef] [PubMed] [Google Scholar]
- Liu P, Chu Z, Lei G, et al. The role of HINT1 protein in morphine addiction: An animal model-based study [J]. Addiction Biology, 2020, 26(2): e12897. [PubMed] [Google Scholar]
- Wang N, Ge F F, Cui C L, et al. Role of glutamatergic projections from the ventral CA1 to infralimbic cortex in context-induced reinstatement of heroin seeking [J]. Neuropsychopharmacology, 2018, 43(6): 1373-1384. [CrossRef] [PubMed] [Google Scholar]
- He X, Wang X, Wang G. Effects of naloxone on the hippocampal electroencephalographic power spectrum in morphine-addicted rats [J]. Chinese Journal of Behavioral Medicine and Brain Science, 2015, 24(10): 869-872(Ch). [Google Scholar]
- Tian S W, Deng H F, Yang Y F. Differential effects of morphine on gamma oscillatory activity in prefrontal cortex and hippocampus of rats [J]. Medical Science Journal Central South China, 2011, 39(1): 45-48(Ch). [Google Scholar]
- Liu F, Jiang H, Zhong W, et al. Changes in ensemble activity of hippocampus CA1 neurons induced by chronic morphine administration in freely behaving mice [J]. Neuroscience, 2010, 171(3): 747-759. [CrossRef] [PubMed] [Google Scholar]
- Fanselow M S, Dong H W. Are the dorsal and ventral hippocampus functionally distinct structures? [J]. Neuron, 2010, 65(1): 7-19. [CrossRef] [PubMed] [Google Scholar]
- Li P. Roles of Hippocampal-Prefrontal Cortical Circuits in Morphine Addiction Memory and Effects of Ethanol Extract of Bidens pilosa in Neural Behaviors [D]. Kunming: Yunnan Normal University, 2017(Ch). [Google Scholar]
- Paxinos G, Franklin K B J. The Mouse Brain in Stereotaxic Coordinates [M]. 2nd Edition. Sydney: Academic Press, 2001. [Google Scholar]
- Tzschentke T M. Review on CPP: Measuring reward with the conditioned place preference (CPP) paradigm: Update of the last decade [J]. Addiction Biology, 2007, 12(3/4): 227-462. [CrossRef] [PubMed] [Google Scholar]
- Lu G Y, Wu N, Li J. Effect of different extinction methods on morphine-induced conditioned place preference in mouse [J]. Journal of International Pharmaceutical Research, 2014, 41(4): 473-477(Ch). [Google Scholar]
- Zhao S Y, Bin J, Shao X X, et al. The changes of dopamine in hippocampal CA1 in CPP activition model induced by morphine in rats [J]. Journal of Kunming Medical University, 2009, 30(5): 29-32(Ch). [Google Scholar]
- Shao X X, Zhao Y N, Li S Q, et al. Ultrastructural changes in hippocampal CAl during morphine induced conditioned place preference establishment and extinction in rats [J]. Journal of Kunming Medical University, 2011, 32(6): 22-26(Ch). [Google Scholar]
- Cui Y, Li L, Guo P J, et al. Research of acquisition and extinction of conditioned place preference in morphine-induced rats [J]. Chinese Journal Modern Drug Application, 2015, 9(17): 276-277(Ch). [Google Scholar]
- Yu R. Wireless Telemetry Electrical Activity on Nucleus Accumbens Shell in Morphine-Induced CPP and Morphine-Induced Extinction Rats [D]. Wuhu: Wannan Medical College, 2015(Ch). [Google Scholar]
- Li J, Pan Q W, Zhu Z M, et al. Telemetering changes of brain electrical activity in morphine dependent rats during drug-seeking retreat stage [J]. Journal of Southern Medical University, 2015, 35(5): 733-737(Ch). [Google Scholar]
- Kota S, Rugg M D, Lega B C. Hippocampal theta oscillations support successful associative memory formation [J]. The Journal of Neuroscience, 2020, 40(49): 9507-9518. [CrossRef] [PubMed] [Google Scholar]
- Lega B, Burke J, Jacobs J, et al. Slow-theta-to-gamma phase-amplitude coupling in human hippocampus supports the formation of new episodic memories [J]. Cerebral Cortex, 2014, 26(1): 268-278. [Google Scholar]
- Fisher M L, LeMalefant R M, Zhou L Y, et al. Distinct roles of CREB within the ventral and dorsal hippocampus in mediating nicotine withdrawal phenotypes [J]. Neuropsychopharmacology, 2017, 42(8): 1599-1609. [CrossRef] [PubMed] [Google Scholar]
- Zhou Y M, Yan E H, Cheng D Q, et al. The projection from ventral CA1, not prefrontal cortex, to nucleus accumbens core mediates recent memory retrieval of cocaine-conditioned place preference [J]. Frontiers in Behavioral Neuroscience, 2020, 14: 558074. [CrossRef] [PubMed] [Google Scholar]
- Wang Y P, Zhang H Y, Cui J J, et al. Opiate-associated contextual memory formation and retrieval are differentially modulated by dopamine D1 and D2 signaling in hippocampal-prefrontal connectivity [J]. Neuropsychopharmacology, 2019, 44(2): 334-343. [CrossRef] [PubMed] [Google Scholar]
- Chimbar L, Moleta Y. Naloxone effectiveness: A systematic review [J]. Journal of Addictions Nursing, 2018, 29(3): 167-171. [CrossRef] [PubMed] [Google Scholar]
- Grasing K, Szeto H. Naloxone causes a dose-dependent increase in total power and delta wave activity in the EEG of opioid-naive rats [J]. The Journal of Pharmacology and Experimental Therapeutics, 1991, 259(1): 464-469. [PubMed] [Google Scholar]
- Malboosi N, Nasehi M, Hashemi M, et al. The neuroprotective effect of NeuroAid on morphine-induced amnesia with respect to the expression of TFAM, PGC-1α, ΔfosB and CART genes in the hippocampus of male Wistar rats [J]. Gene, 2020, 742: 144601. [CrossRef] [PubMed] [Google Scholar]
- Jafarinejad-Farsangi S, Farazmand A, Rezayof A, et al. Proteome analysis of rat hippocampus following morphine-induced amnesia and state-dependent learning [J]. Iranian Journal of Pharmaceutical Research, 2015, 14(2): 591-602. [PubMed] [Google Scholar]
- Mattei V, Martellucci S, Santilli F, et al. Morphine withdrawal modifies prion protein expression in rat hippocampus [J]. PLoS One, 2017, 12(1): e0169571. [Google Scholar]
- Heidari M H, Amini A, Bahrami Z, et al. Effect of chronic morphine consumption on synaptic plasticity of rat's hippocampus: A transmission electron microscopy study [J]. Neurology Research International, 2013, 2013: 290414. [PubMed] [Google Scholar]
All Figures
|
Fig. 1 Timeline of behavioral and EEG experiments after different extinction treatments on the morphine-CPP mice CPP: conditioned place preference; SAL: saline; MOR: morphine; TE: training extinction; NE: natural extinction; NX: naloxone |
| In the text | |
|
Fig. 2 Effects of different extinction treaments on the MOR-CPP scores in mice (a) Photos of the position of the recording electrode tips (coronal slices with cresyl violet staining); (b) training extinction; (c) natural extinction; The arrows indicated the target area in the dorsal or ventral hippocampus; * P < 0.05, ** P < 0.01 (independent-sample t test, vs. SAL); # P < 0.05, ## P < 0.01 (paired-sample t test, vs. baseline) |
| In the text | |
|
Fig. 3 Effect of different extinction treatments and naloxone on the total EEG power in mouse dorsal and ventral hippocampus (a) Absolute lineal power from DH; (b) Relative lineal power from DH; (c) Absolute lineal power from VH; (d) Relative lineal power from VH; * P < 0.05, ** P < 0.01 (ANOVA, significant difference between groups at the same phases after NX injection); BL: baseline |
| In the text | |
|
Fig. 4 Effect of extinction treatments on the hippocampal EEG power spectrum (baseline) in mice Independent sample t test: * P < 0.05, ** P < 0.01 vs. SAL; # P < 0.05, ## P < 0.01 vs. NE; paired sample t test: & P < 0.05, && P < 0.01 vs. VH |
| In the text | |
|
Fig. 5 The hippocampal EEG power spectrum changing (Δ/%) after naloxone treatment in mice BL: baseline; One-way ANOVA: * P < 0.05, ** P < 0.01 |
| In the text | |
Current usage metrics show cumulative count of Article Views (full-text article views including HTML views, PDF and ePub downloads, according to the available data) and Abstracts Views on Vision4Press platform.
Data correspond to usage on the plateform after 2015. The current usage metrics is available 48-96 hours after online publication and is updated daily on week days.
Initial download of the metrics may take a while.