Open Access
Fig. 9
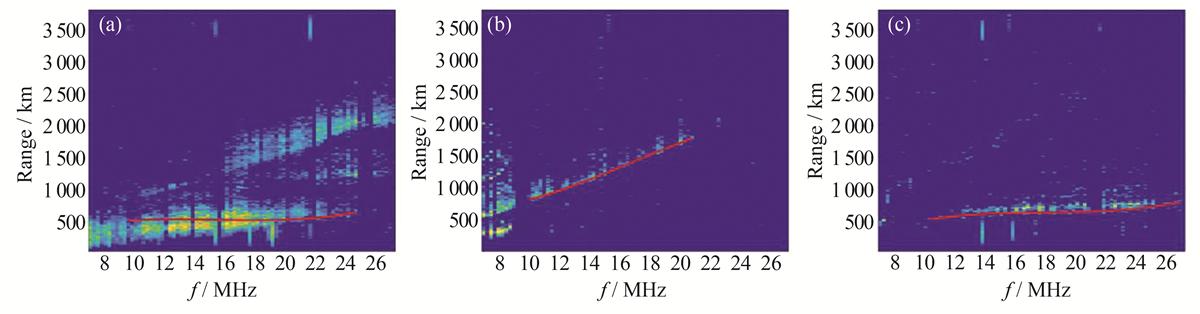
Leading edge ionograms before pattern recognition
Download original image
(a) Ionogram with typical Es layer echoes and F layer echoes coexisting; (b) Ionogram with only F layer echoes; (c) Ionogram with Es layer echoes
Current usage metrics show cumulative count of Article Views (full-text article views including HTML views, PDF and ePub downloads, according to the available data) and Abstracts Views on Vision4Press platform.
Data correspond to usage on the plateform after 2015. The current usage metrics is available 48-96 hours after online publication and is updated daily on week days.
Initial download of the metrics may take a while.