| Issue |
Wuhan Univ. J. Nat. Sci.
Volume 30, Number 1, February 2025
|
|
|---|---|---|
| Page(s) | 69 - 78 | |
| DOI | https://doi.org/10.1051/wujns/2025301069 | |
| Published online | 12 March 2025 | |
Information Technology
CLC number: P352.7
Pattern Recognition and Leading Edge Extraction for the Backscatter Ionograms by YOLOX
基于YOLOX对斜返电离图的模式识别和前沿提取
Electronic Information School, Wuhan University, Wuhan 430072, Hubei, China
† Corresponding author. E-mail: This email address is being protected from spambots. You need JavaScript enabled to view it.
Received:
14
June
2024
Abstract
The ionosphere is an important component of the near Earth space environment. The three common methods for detecting the ionosphere with high frequency (HF) radio signals are vertical detection, oblique detection, and oblique backscatter detection. The ionograms obtained by these detection methods can effectively reflect a large amount of effective information in the ionosphere. The focus of this article is on the oblique backscatter ionogram obtained by oblique backscatter detection. By extracting the leading edge of the oblique backscatter ionogram, effective information in the ionosphere can be inverted. The key issue is how to accurately obtain the leading edge of the oblique backscatter ionogram. In recent years, the application of pattern recognition has become increasingly widespread, and the YOLO model is one of the best fast object detection algorithms in one-stage. Therefore, the core idea of this article is to use the newer YOLOX object detection algorithm in the YOLO family to perform pattern recognition on the F and Es layers echoes in the oblique backscatter ionogram. After image processing, a single-layer oblique backscatter echoes are obtained. It can be found that the leading edge extraction of the oblique backscatter ionogram obtained after pattern recognition and image processing by the YOLOX model is more fitting to the actual oblique backscatter leading edge.
摘要
电离层是近地空间环境的一个重要组成部分。利用高频(HF)无线电信号探测电离层的三种常见方法是垂直探测、斜向探测和斜向返回散射探测。通过这些探测方法获得的电离图可以有效地反映电离层中的大量有效信息。本文的研究重点是通过斜向返回散射探测获得的斜向返回散射电离图。通过提取斜向返回散射电离图的前沿,可以反演电离层中的有效信息。如何准确地获得斜向返回散射电离图的前沿是本文研究的关键问题。近年来,模式识别的应用越来越广泛,YOLO模型是单阶段快速目标检测的最佳算法之一。因此,本文的核心思想是使用YOLO家族中较新的YOLOX目标检测算法对斜向返回散射电离图中的F和Es层回波进行模式识别。将模式识别后的斜向返回散射电离图经过图像处理后,得到单层斜向返回散射回波的电离图。可以发现,通过YOLOX模型进行模式识别和图像处理后获得的斜向返回散射电离图的前沿描迹更符合实际情况下的斜向返回散射前沿描迹。
Key words: ionosphere / backscatter ionogram / leading edge / YOLOX pattern recognition
关键字 : 电离层 / 斜返电离图 / 前沿 / YOLOX模式识别
Cite this article: MA Jiasheng, YANG Guobin, JIANG Chunhua, et al. Pattern Recognition and Leading Edge Extraction for the Backscatter Ionograms by YOLOX[J]. Wuhan Univ J of Nat Sci, 2025, 30(1): 69-78.
Biography: MA Jiasheng, male, Master candidate, research direction: space detection technology. E-mail: This email address is being protected from spambots. You need JavaScript enabled to view it.
Foundation item: Supported by the National Natural Science Foundation of China (42104151, 42074184, 42188101, 41727804)
© Wuhan University 2025
 This is an Open Access article distributed under the terms of the Creative Commons Attribution License (https://creativecommons.org/licenses/by/4.0), which permits unrestricted use, distribution, and reproduction in any medium, provided the original work is properly cited.
0 Introduction
The ionosphere can reflect high frequency(HF) radio waves and cause them to propagate obliquely towards distant surfaces. Based on this characteristic, the ionospheric oblique backscatter sounding can be used to monitor the ionospheric state in a wide range[1]. The oblique backscatter ionogram contains valuable information about the ionosphere status along the propagation paths of radio waves. How to extract ionospheric parameters rapidly and accurately from the oblique backscatter ionogram is the basic premise for the application of ionospheric oblique backscatter detection[2]. Feng et al[3] developed edge recognition methods to extract the leading edges of F layer and Es layer from single-layer pattern ionogram; They utilized the focusing effect of the leading edge on the mixed mode graph, and then the score of each data point is defined as the average of energy and gradient. At last, Gaussian weights are calculated. The data point with the highest score is selected from each frequency point as the leading edge, and then a smooth leading edge trace is obtained through polynomial least squares fitting. However, it is difficult to accurately extract leading edges from backscatter ionogram by this automatic algorithm. On the one hand, some serve HF radio frequency interference usually occur in the ionogram[4], on the other hand, there are many echoes patterns including E, Es, F1 and F2 layers in one backscatter ionogram[5]. These conditions make it difficult to extract accurately the leading edge of backscatter ionograms.
In recent years, with the combination of deep learning and object detection tasks, object detection has achieved good application results in various fields. Object detection algorithms based on deep learning are mainly divided into two categories: one is two-stage detection algorithms represented by RCNN series such as Faster RCNN[6] and Mask RCNN[7], which have high detection accuracy, but their detection speed is slow due to large network parameters. The other is one-stage detection algorithms represented by SSD (Single Shot MultiBox Detector)[8] and YOLO[9] series, which have lower detection accuracy than two-stage object detection algorithms, but their detection speed has been greatly improved[10]. Chen et al[11] proposed an improved Faster RCNN based micro operation space object detection algorithm to solve the problem of small target size and unclear features in the micro operation space. Kong et al[12] proposed a photovoltaic module infrared thermal imaging defect detection method based on the improved YOLOv5 algorithm, which effectively improved the problem of low accuracy in detecting and identifying photovoltaic module defects and faults caused by the difficulty in feature extraction and poor real-time performance of existing photovoltaic module defect recognition methods. Xiong et al[13] proposed a helmet wearing detection algorithm based on YOLOX[14] and transformer to solve the occlusion and difficult detection problems caused by dense small targets in helmet wearing detection tasks. In summary, the purpose of the study is to use existing efficient object detection algorithms for pattern recognition of ionogram, in order to solve the problem of difficult distinction of various layer patterns in ionogram, and further improve the accuracy of extracting their leading edge, achieving the goal of better obtaining effective information from ionogram.
YOLOX[14] is a newly emerged one-stage object detection algorithm in the YOLO family in recent years. Compared with other algorithms in the YOLO family, YOLOX integrates the latest developments in object detection with the YOLO series, resulting in a significant improvement in performance while maintaining a high detection speed. Therefore, this article selects the YOLOX object detection algorithm for pattern recognition of ionogram. Due to the lack of strict boundary lines between the E layer, Eslayer, F1 layer, and F2 layer in the ionogram, it is difficult to distinguish them. However, in practical applications, the layer patterns of the backscatter ionogram are often simplistically defined as two layer patterns: The Es layer (including E layer and Es layer) echoes and the F layer (including F1 layer and F2 layer) echoes. Defining the layer patterns of the backscatter ionogram as Es and F layers can reduce the difficulty of pattern recognition and improve the recognition accuracy of the YOLOX object detection algorithm for ionograms. Therefore, the layer patterns of the ionogram are uniformly divided into Es layer and F layer in the following text. This article uses the YOLOX model to identify the positions of the Es and F layers in the ionogram for pattern recognition and distinguishment. The ionogram with only single-layer modes of the Es or F layers can be obtained. Then, the aforementioned leading edge extraction algorithm can obtain the leading edge of the ionogram more accurately.
1 Data
In this study, the oblique backscatter ionograms can be obtained from the ionospheric oblique backscatter sounding system developed by the ionospheric laboratory of Wuhan University. The ionospheric oblique backscatter sounding system, adopts a pseudo-random coding system, the transmitter and receiver were, respectively, installed at Wuhan (30°35′N, 114°18′E) and Xiantao (30°36′N, 113°45′E) station. The ionogram data for this study were recorded by the ionospheric oblique backscatter sounding system, in mid-August, 2022. During this period, there are many echoes patterns including Es, F layer, and their mixed mode echoes on backscatter ionograms. As a result, the data can be used to test the effectiveness of the algorithm.
The ionospheric backscatter sounding system can obtain an oblique backscatter ionogram, which reflects the function relationship between the intensity of the ground backscatter echoes relative to frequency and the group delay of radio wave propagation[15]. The horizontal axis in the ionogram represents the frequency of radio waves, and the vertical axis represents the group delay time. The specific meaning of pixel parameters is the signal-to-noise ratio of the backscatter echoes, which provides a basis for the design and implementation of training algorithm based on the data characteristics. There are three common oblique backscatter echo patterns, namely oblique backscatter ionograms in mixed mode, oblique backscatter ionograms with only F-layer single-layer mode, and oblique backscatter ionograms with only Es-layer single-layer mode.
Figure 1 shows various modes of Es and F layer echoes in ionogram. This study only divides the propagation mode of the ionogram into F layer and Es layer to facilitate the preparation of the training set and improve anchor box discrimination.
 |
Fig. 1 Schematic diagram of different layer mode echoes in ionogram f represents the sounding frequency, P represents the group distance |
Figure 2 shows a typical oblique backscatter ionogram recorded by the ionospheric backscatter sounding system. From Fig. 2, it can be seen that the region of the F-layer echoes is located above and right of the ionogram, indicating the F-layer echoes' group distance information; The region of the Es layer echoes is located at the bottom and left of the ionogram, indicating the local Es layer echoes' group distance information; The region of the remote Es layer echoes is on the right side of the ionogram, indicating the remote Es layer echoes' group distance information.
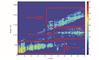 |
Fig. 2 Typical image of oblique backscatter ionogram |
2 Method
In the traditional YOLO series, the feature layer is obtained by meshing the original input image, the grid prediction result is obtained by judging whether there are targets in the prior frame, and the prediction frame is obtained by adjusting the prior frame accordingly[9]. A number of effective improvements have been made in YOLOV3[16] and YOLOV4[17] in order to improve YOLOX[14] which is an enhanced version. YOLOX is characterized by the following characteristics:
a) Main part
Feature point information is stacked onto channels using the Focus network structure. After a small amount of processing, residual modules are directly connected to the end using the CSPnet network structure. The previous YOLO series implemented classification and regression in a convolution of 1×1, in which YOLOX has a negative impact on the recognition of networks. A YOLO Head is implemented in two parts in YOLOX, which are integrated at the time of final prediction.
b) Data enhancement
By combining four images for stitching, mosaic data enhancements have the advantage of enriching the background of the detected object.
c) Anchor free
The Anchor Based Detector requires clustering of prior boxes, which increases time costs and does not adapt to all situations; Anchor increases the complexity of the detection head and the number of results generated. In Anchor Free's decoding code, the logic is simpler and more readable.
d) SimOTA dynamic matching positive sample
Each real frame and current feature point are predicted based on their degree of coincidence. It is necessary to calculate the k of each real frame in order to represent that each real frame has k characteristic points. Based on the prediction accuracy and the inclusion of each feature point, the Cost matrix is calculated. The positive samples of the real frame are the k feature points with the lowest cost.
YOLOX, an enhanced version of the YOLO series, combines the advantages of Focus and CSPnet network structures for feature extraction and Mosaic for data enhancement. This model effect is greatly improved by the innovative application of a new decoupling head, the Anchor Free concept, and SimOTA's dynamic positive sample matching method[18].
Figure 3 shows the entire workflow of pattern recognition and leading edge extraction using the YOLOX object detection algorithm for ionograms. The method in this study is to obtain a data matrix in the format of amp[3] based on the signal-to-noise ratio of the echoes. Then, this data matrix is remade using the Python algorithm to obtain a ionogram in the format of jpg. The kind of ionogram shown in Fig. 1 displays a lot of information, including data information for the Es layer, data information for the F layer, title, coordinate axis, color bar, etc. However, these parts of information cannot be fully utilized in subsequent work, so they need to be preprocessed. By deleting invalid information such as its title, coordinate axis, and color bar, a clean preprocessed ionogram can be obtained for subsequent work. In the following work, this article unifies the original ionogram and the preprocessed ionogram as the Original Data. By conducting leading edge extraction experiments on original data, unprocessed leading edge can be obtained, which usually does not accurately fit the actual leading edge. Then this article will implement the YOLOX model for pattern recognition of oblique backscatter ionograms. First, use artificial block diagrams to label the positions of Es and F layers as preprocessing. After labeling, place these labeled data into the YOLOX model for training. After training, the YOLOX model has preliminarily achieved the effect of automatic recognition and classification of the Es and F layers of the ionograms. Finally, place the preprocessed but unlabeled original data ionograms into the YOLOX model for automatic recognition and classification. YOLOX can obtain the ionograms of the calibrated anchor box after being classified by the YOLOX model, and distinguish the position information of F layer and Es layer. Due to the fact that the ionogram is transformed through a two-dimensional numerical matrix, setting the numerical value to 0 in the position area marked by the anchor box of the F or Es layer can erase the corresponding energy signal information of the F or Es layer from the corresponding ionogram. Therefore, the processed ionogram can only has a single-layer leading edge, so applying the leading edge extraction algorithm to the processed ionogram can obtain leading edge that is more accurately fitted to each-layer mode ionogram.
 |
Fig. 3 The entire workflow diagram of the work |
3 Result
3.1 Experimental Platform
For this study, we used a Windows 10 system with 128 GB of memory, an Intel (R) Core (TM) i9-10940X processor running at 3.3 GHz, and a NVIDIA GeForce RTX 3070 graphics card running at 11.7 CUDA, with PyTorch 1.9.1.
3.2 Dataset
An amp file[3] is used to store the original data of the oblique backscatter ionogram. For image format conversion, we first convert amp file to common jpg file, and then label the F and Es layers in the ionogram samples which are the data images. In the annotation file, the annotation information includes the category of the target object and the coordinates of the target box.
3.3 Training Settings
The maximum number of epochs for training was set to 350 in order to ensure the reliability of the experimental data. The first 50 training sessions freeze the parameters of the backbone network, while the last 300 training sessions thaw the parameters. This model has a maximum learning rate of 1E-2 and a minimum learning rate of 1E-4.
3.4 Training Objectives
Using YOLOX's method, three types of oblique backscatter ionograms were classified: those with only F-layer echoes, with only Es-layer echoes, and with both F-layer echoes and Es-layer echoes simultaneously. The final objective is to extract the leading edge of single-layer echoes. By setting the F-layer position area and Es layer position area calibrated by the YOLOX anchor box to 0 respectively, the three types of oblique backscatter ionograms can be transformed into two types: oblique backscatter ionogram maps with only F-layer single-layer mode and oblique backscatter ionogram maps with only Es layer single-layer mode. Therefore, we only need to extract the leading edge of the single-layer oblique backscatter ionogram.
3.5 Training Results
Figure 4 shows the YOLOX pattern recognition effect diagram. The red anchor box represents the position identification of the F layer, the green anchor box represents the position identification of the Es layer, and the number after it represents the confidence level of the anchor box in calibrating the pattern position of the layer. The higher the confidence level (range 0-1), the higher the confidence level of the region as either the F layer or the Es layer. It should be pointed out that although there is an area marked as the F-layer area in the oblique backscatter ionogram with only the Es layer single-layer mode (Fig. 4(d)). This degree of misjudgment does not affect the final experimental results as the subsequent work will set the F-layer and Es-layer position areas to 0. Through the observation of the experimental result graph, it can be found that the anchor box confidence of both the F layer and the Es layer exceeds 0.8, indicating that YOLOX has extremely high recognition accuracy for these two layer patterns, proving the feasibility of applying the YOLOX neural network recognition algorithm to ionospheric target detection.
 |
Fig. 4 Oblique backscatter ionograms after being locked by YOLOX network anchor box (a) and (b) the oblique backscatter ionogram in mixed mode with weak and strong backscattering in the remote Es layer, (c) and (d) the oblique backscatter ionogram with only the F layer single-layer mode and with only the Es layer single-layer mode, respectively |
4 Discussion
It is proposed that mean Average Precision (mAP)@0.25 is used as an evaluation indicator for model evaluation. This email address is being protected from spambots. You need JavaScript enabled to view it. is related to confusion matrix, accuracy rate, and recall rate. Test results can be divided into True Positive (TP), True Negative (TN), False Positive (FP), and False Negative (FN).
Intersection Over Union (IOU) refers to the area of the overlapping part of two anchor boxes (A and B), which is the ratio of the total area of the two boxes. IOU, also known as intersection union ratio, can be understood literally as the ratio of the intersection and union of two boxes.
 (1)
(1)
The closer the IOU is to 0, the less overlap the two boxes have. The closer the IOU is to 1, the higher the overlap between the two boxes is. The IOU threshold is generally defined as 0.5. When the IOU of two boxes is greater than the threshold, it is judged that the predicted box is correct. The IOU threshold can be modified, and the higher the IOU threshold, the stricter the conditions for judging the correct prediction of the prediction box.
The reason why the confusion matrix IOU threshold value is 0.25 (less than the general value 0.5) is that the oblique backscatter ionogram is different from the ordinary target detection classification image, and its threshold energy point is not so obvious and accurate to differentiate the boundary.
The precision value is defined as the proportion of samples with positive predicted values among all targets:
 (2)
(2)
The P value indicates how many samples predicted to be positive are correct. From Fig. 5, it can be seen that as the score_threhold increases, the precision also increases, and it can be seen that when the score_threhold value range is between 0.1 and 0.7, the precision value of the Es layer stabilizes at about 70%, and the precision value of the F layer stabilizes at about 60%. When the score_threhold is 0.25, the precision value of the Es layer echo is 68.63%, and the precision value of the F layer echo is 60.53%.
 |
Fig. 5 Precision values for Es and F layers |
In algorithms, recall rate is measured as the proportion of samples with positive predicted values in the target that also have positive real values:
 (3)
(3)
The R value represents how many tryly positive samples are correctly predicted to be positive.
From Fig.6, it can be seen that as the score_threhold increases, the recall rate decreases continuously. When the value of the score_threhold is between 0.1 and 0.6, the recall rate of the Es layer echo is about 80%, and the recall rate of the F layer echo is about 90%. When score_threhold is set to 0.25, the recall rate of Es layer echo is 81.40%, and the recall rate of F layer echo is 93.88%.
 |
Fig. 6 Recall values for Es and F layers |
When the value of IOU is 0.25, the calculation formulas for AP and mAP are:
 (4)
(4)
 (5)
(5)
The AP value is used to calculate the average precision of different categories. From Fig. 7, it can be seen that as the recall rate increases, the precision rate decreases continuously. When the recall rate is between 0.2 and 0.6, the precision rate of the Es layer echo is about 80%, and the precision rate of the F layer echo is also about 80%. When the score_threhold is set to 0.25, the AP value of Es layer echo is 79.94%, and the AP value of F layer echo is 78.65%. When object detection and recognition is a binary classification problem, the value of mAP is equal to the AP value. So when the score_threhold is set to 0.25, the mAP value of Es layer echo is 79.94%, and the mAP value of F layer echo is 78.65%.
 |
Fig. 7 AP values for Es and F layers |
The average of precision and recall based on the value of F1 (F1score) can be calculated by the following equation:
 (6)
(6)
The F1 value is the harmonic mean of precision rate and recall rate.
From Fig. 8, it can be seen that as the score_threhold increases, the F1 value decreases continuously. When the score_threhold is between 0.1 and 0.7, the F1 value of the Es layer echo is about 85%, and the F1 value of the F layer echoes is also about 85%. When the score_threhold is set to 0.25, the F1 value of Es layer echo is 0.86, and the F1 value of F layer echo is 0.84.
 |
Fig. 8 F1 values for Es and F layers |
Results of the experiments indicate that the YOLOX neural network is capable of accurately identifying and classifying the information of F and Es layers of the oblique backscatter ionogram (Table 1). The Es layer's precision is capable of reaching 68.63%, and the F layer's precision can reach 60.53%; the Es layer's recall rate can reach 81.40%, and the F layer's recall rate can reach 93.88%; the Es layer's mAP value can reach 79.94% and the F layer's mAP value can reach 78.65%; the Es layer's F1 value can reach 0.86 and the F layer's F1 value can reach 0.84.
From the leading edge ionograms before pattern recognition (Fig. 9), it can be seen that the leading edge extraction algorithm has a high accuracy in leading edge extraction when performing leading edge extraction on oblique backscatter ionograms with only single-layer mode. However, for mixed mode oblique backscatter ionograms, this method may have significant distortion.
 |
Fig. 9 Leading edge ionograms before pattern recognition (a) Ionogram with typical Es layer echoes and F layer echoes coexisting; (b) Ionogram with only F layer echoes; (c) Ionogram with Es layer echoes |
Figure 10(a) shows that when the Es layer region of the mixed mode oblique backscatter ionogram is set to 0, an oblique backscatter ionogram with only a single layer of F layer is obtained. By extracting the leading edge, it can be found that its leading edge highly matches the F layer. Figure 10(b) shows that when the F-layer region of the mixed mode oblique backscatter ionogram is set to 0, an oblique backscatter ionogram with only a single layer of Es layer is obtained. By extracting the leading edge, it can be found that its leading edge highly matches the Es layer. In Fig. 10(c), the Es layer region is set to 0 in the oblique backscatter ionogram with only the F layer single-layer mode. Even if there is no Es layer echo signal in this type of mode ionogram, this method can still be used to eliminate possible clutter signal interference in the Es layer region, further improving the accuracy of the F layer leading edge extraction. In Fig. 10(d), the oblique backscatter ionogram with only single-layer Es mode is processed by setting the F layer region to 0. Even if there is no F layer echo signal in this type of mode ionogram, this method can still eliminate possible clutter signal interference in the F layer region, further improving the accuracy of the Es layer leading edge extraction. From the above images and descriptions, it can be seen that the leading edge extraction algorithm has a high accuracy in extracting single-layer oblique backscatter leading edge. Compared with the leading edge extraction method proposed by Feng et al[3], this method uses YOLOX pattern recognition to distinguish between the Es layer region and the F layer region. By setting the values to 0 for these two regions separately, the three types of oblique backscatter ionograms can be simplified into two categories, thus avoiding the disadvantage of inaccurate leading edge extraction for mixed mode oblique backscatter ionograms and amplifying the advantage of accurate leading edge extraction for single-layer oblique backscatter ionograms.
 |
Fig. 10 Leading edge ionograms after pattern recognition (a) Oblique backscatter ionogram when the Es layer region of the mixed mode oblique backscatter ionogram is set to 0; (b) Oblique backscatter ionogram when the F-layer region of the mixed mode oblique backscatter ionogram is set to 0; (c) Oblique backscatter ionogram with only single-layer F mode processed by setting the Es layer region to 0; (d) Oblique backscatter ionogram with only single-layer Es mode processed by setting the F layer region to 0 |
The differences in various indicators between the Es layer and the F layer automatically identified and summarized by YOLOX
5 Conclusion
This study used the YOLOX object detection algorithm to perform pattern recognition on three types of oblique backscatter ionograms, including single-layer oblique backscatter ionograms with only F-layer echoes, single-layer oblique backscatter ionograms with only Es layer echoes, and mixed mode oblique backscatter ionograms with both F and Es layers. By YOLOX pattern recognition, two types of oblique backscatter ionograms were obtained: single-layer oblique backscatter ionograms with only F layer echoes and single-layer oblique backscatter ionograms with only Es layer echoes.
This method simplifies the leading edge extraction process and improves the accuracy of extraction. While YOLOX anchor boxes calibrate the position of irregular shapes in a rectangular manner, which will reduce the effectiveness of extracting leading edge. The future optimization plan is to convert YOLOX's anchor boxes into polygons or irregular shapes, which will reduce the error rate of position calibration for irregular shape areas and improve the accuracy of effective information.
References
- Croft T A. Sky-wave backscatter: A means for observing our environment at great distances[J]. Reviews of Geophysics, 1972, 10(1): 73-155. [NASA ADS] [CrossRef] [Google Scholar]
- Liu W, Jiao P N, Wang J J. An inverse algorithm of oblique ionogram and its stability [J]. Chinese Journal of Radio Science, 2003, 18(6): 597-601 (Ch). [Google Scholar]
- Feng J, Li X, Qi D Y. Methods for extracting backscatter ionogram leading edges[J]. Chinese Journal of Space Science, 2012, 32(4): 524-531 (Ch). [NASA ADS] [CrossRef] [Google Scholar]
- Jiao P N. The ionospheric undulations during the annular eclipse of September 23, 1987 [J]. Chinese Journal of Geophysics, 1990, 33(4): 391-398 (Ch). [Google Scholar]
- Yang Z J, Shi Z H, Guan R S. Using frequency sweep backward scattering study of the ionospheric effects of the annular solar eclipse [J]. Chinese Journal of Raido Sci., 1990, 5(1): 10-17 (Ch). [Google Scholar]
- Ren S Q, He K M, Girshick R, et al. Faster R-CNN: Towards real-time object detection with region proposal networks[J]. IEEE Transactions on Pattern Analysis and Machine Intelligence, 2017, 39(6): 1137-1149. [CrossRef] [Google Scholar]
- He K M, Gkioxari G, Dollár P, et al .Mask R-CNN[C]//2017 IEEE International Conference on Computer Vision (ICCV). New York: IEEE, 2017: 2980-2988. [Google Scholar]
- Liu W, Anguelov D, Erhan D, et al .SSD: Single shot MultiBox detector[C]//European Conference on Computer Vision. Cham: Springer-Verlag, 2016: 21-37. [Google Scholar]
- Redmon J, Divvala S, Girshick R, et al .You only look once: Unified, real-time object detection[C]//2016 IEEE Conference on Computer Vision and Pattern Recognition (CVPR). New York: IEEE, 2016: 779-788. [Google Scholar]
- Zhang J. Small target detection based on improved Faster-RCNN[J]. Modern Computer, 2023, 29(14): 14-18 (Ch). [Google Scholar]
- Chen G L, Pang Y S. Micro operating space target detection algorithm based on improved Faster RCNN[J]. Transducer and Microsystem Technologies, 2024, 43(3): 144-151 (Ch). [Google Scholar]
- Kong S T, Xu Z Z, Lin X Y, et al. Infrared thermal imaging defect detection of photovoltaic module based on improved YOLOv5 algorithm[J]. Infrared Technology, 2023, 45(9): 974-981 (Ch). [Google Scholar]
- Xiong W, Zhang Z T, Lu X, et al. An improved YOLOX based algorithm for detecting the wearing of safety helmets[J]. Information Technology and Informatization. 2024(2): 20-26 (Ch). [Google Scholar]
- Ge Z, Liu S T, Wang F, et al. YOLOX: Exceeding YOLO series in 2021[EB/OL]. [2024-05-10].http://arxiv.org/abs/2107.08430. [Google Scholar]
- Zhang X M, Zhao Z Y, Zhang Y N. Investigation of low-latitude ionospheric field-aligned irregularities by oblique backscatter sounding[J]. IEEE Geoscience and Remote Sensing Letters, 2010, 7(2): 241-245. [NASA ADS] [CrossRef] [Google Scholar]
- Redmon J, Farhadi A. YOLOv3: An incremental improvement[EB/OL]. [2024-05-10].http://arxiv.org/abs/1804.02767. [Google Scholar]
- Bochkovskiy A, Wang C Y, Liao H Y M. YOLOv4: Optimal speed and accuracy of object detection[EB/OL]. [2024-05-25]. http://arxiv.org/abs/2004.10934. [Google Scholar]
- Lin T Y, Dollár P, Girshick R, et al .Feature pyramid networks for object detection[C]//2017 IEEE Conference on Computer Vision and Pattern Recognition (CVPR). New York: IEEE, 2017: 936-944. [Google Scholar]
All Tables
The differences in various indicators between the Es layer and the F layer automatically identified and summarized by YOLOX
All Figures
|
Fig. 1 Schematic diagram of different layer mode echoes in ionogram f represents the sounding frequency, P represents the group distance |
| In the text | |
|
Fig. 2 Typical image of oblique backscatter ionogram |
| In the text | |
|
Fig. 3 The entire workflow diagram of the work |
| In the text | |
|
Fig. 4 Oblique backscatter ionograms after being locked by YOLOX network anchor box (a) and (b) the oblique backscatter ionogram in mixed mode with weak and strong backscattering in the remote Es layer, (c) and (d) the oblique backscatter ionogram with only the F layer single-layer mode and with only the Es layer single-layer mode, respectively |
| In the text | |
|
Fig. 5 Precision values for Es and F layers |
| In the text | |
|
Fig. 6 Recall values for Es and F layers |
| In the text | |
|
Fig. 7 AP values for Es and F layers |
| In the text | |
|
Fig. 8 F1 values for Es and F layers |
| In the text | |
|
Fig. 9 Leading edge ionograms before pattern recognition (a) Ionogram with typical Es layer echoes and F layer echoes coexisting; (b) Ionogram with only F layer echoes; (c) Ionogram with Es layer echoes |
| In the text | |
|
Fig. 10 Leading edge ionograms after pattern recognition (a) Oblique backscatter ionogram when the Es layer region of the mixed mode oblique backscatter ionogram is set to 0; (b) Oblique backscatter ionogram when the F-layer region of the mixed mode oblique backscatter ionogram is set to 0; (c) Oblique backscatter ionogram with only single-layer F mode processed by setting the Es layer region to 0; (d) Oblique backscatter ionogram with only single-layer Es mode processed by setting the F layer region to 0 |
| In the text | |
Current usage metrics show cumulative count of Article Views (full-text article views including HTML views, PDF and ePub downloads, according to the available data) and Abstracts Views on Vision4Press platform.
Data correspond to usage on the plateform after 2015. The current usage metrics is available 48-96 hours after online publication and is updated daily on week days.
Initial download of the metrics may take a while.