| Issue |
Wuhan Univ. J. Nat. Sci.
Volume 30, Number 4, August 2025
|
|
|---|---|---|
| Page(s) | 343 - 354 | |
| DOI | https://doi.org/10.1051/wujns/2025304343 | |
| Published online | 12 September 2025 | |
CLC number: U446.2
Portable Multimodal Vision-Based Device for Non-Destructive Evaluation of Rebar Welds
基于多模态视觉的便携式焊缝无损检测装置
1
Research Institute of Highway Ministry of Transport, Beijing 100088, China
2
School of Electronic and Control Engineering, Chang’an University, Xi’an 710000, Shaanxi, China
3
Xizang Transportation Survey & Design Institute Co., Ltd., Lhasa 850000, Xizang Autonomous Rigion, China
† Corresponding author. E-mail: This email address is being protected from spambots. You need JavaScript enabled to view it.
Received:
8
August
2024
Abstract
The quality of rebar welds directly impacts the overall service performance of highway infrastructure. However, current assessments of weld appearance quality primarily rely on traditional inspection methods such as manual visual inspection, which suffer from significant limitations in accuracy, reliability, and efficiency. Given the increasing demand for safety performance inspections of highway infrastructure in China, traditional methods struggle to meet modern rapid inspection requirements. Therefore, this study proposes the design of a portable, non-destructive inspection device for rebar weld appearance, utilizing visible light vision and line-structured light 3D scanning technology. The device is equipped with an STM32 master control chip to manage encoder reading, scanning laser control, ring fill light, industrial camera synchronization, image acquisition, and serial port command transmission. Additionally, a weld image processing and detection software system was developed to receive, store, and identify weld defects. A field inspection prototype was created and subjected to various defect weld detection experiments in a laboratory setting. Experimental results demonstrate that the device can accurately measure weld parameters by acquiring multimodal images, fulfilling defect detection requirements. The device features high detection accuracy, portability, and user-friendliness, making it significant for the objective inspection and evaluation of rebar weld appearance and welding quality.
摘要
钢筋的焊接质量直接影响公路基础设施整体服役性能,然而现阶段钢筋焊缝外观质量的评估主要依赖于人工目检等传统检测方法,在准确性、可靠性和效率方面存在显著局限性。在我国公路基础设施安全性能检测需求日益增长的背景下,传统检测手段已难以满足如今的快速检测要求。为此,本文基于可见光视觉与线结构光3D扫描技术,设计了一种便携式钢筋焊缝外观无损检测装置。该装置采用STM32主控芯片,负责管理编码器读取、扫描激光控制、环形补光、工业相机同步、图像采集以及串口指令传输。同时,开发了一套焊缝图像处理与检测软件系统,用于接收、存储和识别焊缝缺陷。实验室条件下,研究团队制作了原型机,并开展了多种焊缝缺陷的检测实验。结果表明,该装置通过多模态图像采集,可精确检测焊缝参数,完全满足钢筋焊缝缺陷检测需求。装置具有检测精度高、便携性强、操作简便等特点,为钢筋焊缝外观及焊接质量的快速检测与科学评估提供了重要技术支撑。
Key words: rebar welds / weld performance defect / morphological inspection / visual scanning / line structure light
关键字 : 钢筋焊缝 / 焊接性能缺陷 / 形态检测 / 视觉扫描 / 线结构光
Cite this article: TANG Yu, PENG Lu, HE Zhihui, et al. Portable Multimodal Vision-Based Device for Non-Destructive Evaluation of Rebar Welds[J]. Wuhan Univ J of Nat Sci, 2025, 30(4): 343-354.
Biography: TANG Yu, male, Master, Assistant researcher, research direction: bridge engineering, calibration and highway measurement, etc. E-mail: This email address is being protected from spambots. You need JavaScript enabled to view it.
Foundation item: Supported by the Central Public-Interest Scientific Institution Basal Research Fund(2023-9062) and the Transport Power Pilot Project(2021-C334)
© Wuhan University 2025
 This is an Open Access article distributed under the terms of the Creative Commons Attribution License (https://creativecommons.org/licenses/by/4.0), which permits unrestricted use, distribution, and reproduction in any medium, provided the original work is properly cited.
0 Introduction
As a crucial component of infrastructure, the quality of rebar frameworks significantly impacts structural reliability. Rebar connection are primarily achieved through welding, making the detection and evaluation of weld quality particularly critical. Inspection of rebar weld appearance quality involves analyzing surface morphology, geometric shape, and existing defects, followed by appropriate evaluation[1]. Key parameters such as three-dimensional (3D) morphology and surface flatness of the weld determine stress concentration levels, thus making appearance inspection essential for ensuring weld forming quality[2].
Traditional detection methods, including manual inspection using weld gauges and auxiliary magnetic particle inspection, are inefficient and prone to subjective errors, making them unsuitable for long-term continuous monitoring[3-5]. With increasing quality demands in China’s engineering construction and the adoption of advanced digital technologies, the demand for precise, reliable, and automated rebar weld inspection has significantly increased. The inefficiency, delayed feedback, and high error rates of manual inspections necessitate serious attention from construction and quality management personnel. As a result, the development of high-tech inspection tools has become an inevitable trend for rebar weld inspection and new infrastructure construction.
Currently, in addition to traditional manual inspection methods, scholars worldwide have integrated nondestructive testing techniques into rebar weld inspection, such as ultrasonic flaw detection, structured light scanning, X-ray, and structured light vision detection technology[6-9]. Within the Chinese academic community, Wang et al[10] developed a method and a stable and reliable detection system based on vision detection technology for weld inspection in automotive hydraulic torque converters, using charge-coupled device (CCD) to capture weld images for computer processing to detect surface weld defects. Wang[11] studied 3D detection technology for steel plates surface defects based on linear laser, utilizing area array cameras to capture images of linear laser beams vertically projected onto the steel plate surface to calculate surface defect depths. However, this detection technology exhibits limitation in applicable materials of varying sizes. Zhao et al[12] proposed a portable laser scanning-based device for automatic weld detection and evaluation, which uses structured light scanning to obtain the weld cross-section and evaluates weld quality through statistical analysis of the 3D morphology of the weld. Internationally, White et al[13] developed an online weld profile vision detection system capable of measuring fillet and butt welds. Cook et al[14] designed targeted feature extraction algorithms for different welding processes based on human reasoning processes, enhancing evaluation reliability while ensuring simplicity. Noruk[15] introduced a weld inspection scanner and controller (WISC) device used for collecting weld profile information and calculating weld parameters to assess compliance with quality standards. This device features high accuracy and allows data archiving for easy querying. Lee et al[16] studied a structured light vision-based weld inspection system for collecting parameters such as weld size and chamfer, combining grayscale image feature extraction to identify weld defects, thereby improving the accuracy of detecting weld defects including porosity and cracks. Jablonski et al[17] designed a vision detection system for weld quality assessment, utilizing cameras to capture and analyze visible light and infrared images of welds, and calculating parameters of both external appearance and internal defects to realize comprehensive weld quality inspection.
This paper combines laser technology with 3D machine vision technology to capture the geometric morphology of rebar welds using structured light scanning and visible light image scanning with high-precision image processing algorithms. By calculating cross-sectional geometric shapes, the method determines geometric parameters such as weld length and width. Moreover, it identifies 3D defects such as fullness and porosity to assess welding quality. This approach features high automation, convenience, rapidity, resistance to external interference, and non-contact measurement, making it an excellent solution.
1 Welding Defects and Design of the Detection System
1.1 Welding Defects
Defects in reinforcement welding refer to the failure of welds to meet specified quality standards due to improper operation, equipment malfunction, material issues, or environmental factors during the welding process. These defects can severely deteriorate the performance of the entire structural system, leading to reduced load-bearing capacity, decreased durability, increased maintenance costs, and potential safety hazards. The primary types of welding defects include: (1) Surface irregularities: Such irregularities can cause stress concentrations, increasing the risk of cracks and fatigue failure, and compromising the structure’s sealing capability; (2) Porosity: Porosity reduces the effective cross-sectional area of the weld, consequently decreasing its load-bearing capacity and potentially inducing corrosion, which could lead to premature weld failure; (3) Cracks: Cracks significantly reduce the weld’s strength and reliability, potentially causing sudden structural failure and safety accidents (see Fig. 1). Therefore, ensuring weld quality and carrying out effective inspections are crucial steps in construction and engineering projects.
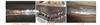 |
Fig. 1 Typical defects in rebar welds |
Traditional methods for detecting rebar welds, such as manual inspection and magnetic particle testing, suffer from various issues including low accuracy, insufficient efficiency, poor consistency, and a lack of reliability. In order to tackle these challenges, this paper introduces a portable, multi-modal vision-based non-destructive testing device for the visual inspection of rebar welds. This device makes use of visible light vision and line-structured light 3D scanning technologies.
1.2 Principle of the Multi-Modal Vision Scanning System for Rebar Weld Detection
The primary functions of the rebar weld detection system include: receiving and storing the images of the welds, documenting the weld workpieces to be tested, performing comprehensive system calibration, and acquiring the 3D information of the welds. Furthermore, the system is capable of detecting the weld parameters, as illustrated in the detection process shown in Fig. 2.
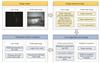 |
Fig. 2 Flowchart of weld detection |
The proposed multi-modal vision-based system for the non-destructive evaluation of rebar welds follows a four-stage workflow: Image input, Image preprocessing, Core algorithm processing, and Parameter result evaluation. It captures laser stripe and visible light images, and enhances these images through operations such as segmentation, stripe thinning, and denoising. Advanced algorithms, including breakpoint compensation, least squares fitting, multi-modal image fusion, and image stitching, are utilized to analyze the weld characteristics, while endpoint recognition ensures precise dimension measurements. Key parameters such as the weld width, the crown height, the length, the porosity, and the bead quality are evaluated. This system offers a portable, efficient, and accurate solution for on-site weld inspection in infrastructure projects.
1.3 Design of the Multi-Modal Vision Scanning System for Rebar Weld Detection
The multi-modal visual scanning system for rebar inspection employs a modular design approach, comprising a control system, an image acquisition and transmission system, and an image processing and storage system, as depicted in Fig. 3. The system enables online detection and evaluation of weld quality, facilitating the supervision of on-site worker performance and assisting quality inspection personnel in their duties. The control system includes a control chip circuit board (STM32) and a micro rotary encoder, primarily responsible for the movement and control commands of the acquisition instrument. The image acquisition and transmission system, serving as the core of the setup, incorporates a VONETS forwarding module, industrial cameras, a line laser, and a ring light.
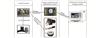 |
Fig. 3 System structure diagram |
The image processing and storage system processes images from two distinct visual modes independently. By employing various image processing algorithms, it is able to identify the feature points within the images. Through the transformation of the calibrated system parameters, the system calculates the final 3D coordinates of these feature points, thus completing the index detection. Subsequently, a method based on information entropy is used to analyze the welds and generate measurement results. The detailed design architecture is shown in Fig. 4.
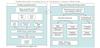 |
Fig. 4 System overall architecture diagram |
1.4 Hardware System Design
The operational principle and workflow of the hardware system are as follows: At the instant the button is pressed, the count of the miniature rotary encoder is reset, and simultaneously, the ring light is switched on to provide supplementary illumination. Subsequently, the industrial camera proceeds to take a photograph, capturing a single frame of image which is then transmitted through the camera’s Ethernet port to the VONETS module. The module’s built-in WiFi unit handles the task of forwarding the image to the computer. Once the port unit receives commands from the control chip, it swiftly transmits these commands to the computer using the User Datagram Protocol (UDP). In response, the software system names and archives this frame of image according to the received commands. When the device has moved a predetermined distance, it triggers the laser, which projects a laser beam onto the surface of the steel bar weld. Then, the camera collects the image data of the laser reflection stripes. The external casing and bottom structure of the hardware system are depicted in Fig. 5.
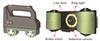 |
Fig. 5 Hardware system construction |
1.5 Image Acquisition Software Design
To achieve data visualization, a sophisticated image reception and visualization software has been designed with Microsoft Visual Studio 2017, leveraging the Microsoft Foundation Class (MFC) framework for developing the image interface application. This design follows the principles of object-oriented programming. The host computer interfaces with the hardware via the UDP, displaying the uploaded images on the user interface and storing them as well. The software interface is able to showcase the original images, the segmented visible light images, and the overlay effects of the processed laser images combined with visible light images. After numerous tests, the system’s detection accuracy has been demonstrated to reach 0.1 mm. Furthermore, the software is capable of saving the detection results for systematic archiving and organization.
2 Detection of Apparent Parameters of Rebar Welds
During the weld inspection process, the weld morphology is primarily evaluated based on four key indicators: width, thickness, saturation, and length.
2.1 Weld Width Detection Method
The collected image data is analyzed to characterize the weld, and the structured light stripes reflected from the weld are processed to fit the contour centerline and extract relevant parameters. By identifying feature points and applying the geometric relationships of spatial coordinates, and combining with the system calibration data, the apparent dimensions of the weld are calculated. The feature points at the weld toe are primarily determined through least-squares curve fitting to establish reference points. Multi-modal image overlay processing is then employed to identify the intersection of the segmented welding area image and the laser stripe image, pinpointing the final feature points.
2.1.1 Preliminary extraction of weld toe feature points
Since the weld toe feature points are necessarily located within the rebar welding area, and the laser stripe appears as an approximately straight line on the ground, the ROI has been further reduced. This reduction simplifies curve fitting, decreases computational load, and enhances the speed of image processing. The curve fitting region is illustrated in Fig. 6.
 |
Fig. 6 Curve fitting region |
The refined image within the curve fitting ROI is processed using polynomial fitting via the least squares method. Through multiple experiments, it is concluded that a fourth-degree polynomial is optimal for identifying weld toe feature points. The first and second derivatives of the fitted curve are computed, and feature points are defined as the locations where the curvature changes sign. The curve fitting results are presented in Fig. 7, and the identified feature points are shown in Fig. 8.
 |
Fig. 7 Curve fitting results |
 |
Fig. 8 Preliminary feature points |
In addition to the above methods for identifying weld toe feature points, 3D scanning imaging technology plays a crucial role in obtaining more comprehensive information about the weld. During line-structured light 3D scanning, the projected laser stripe deforms according to the surface topography of the rebar weld. By analyzing the deformed laser stripe in the captured 3D scan images, the system can precisely extract the cross-section height information of the weld through a series of complex calculations. First, the position and shape of the laser stripe in the 3D space are determined based on the known parameters of the scanning device and calibration data. Then, the height difference between points on the weld surface are calculated by comparing the laser stripe’s coordinates at different locations, enabling accurate identification of the highest and the lowest points in the weld cross-section. This cross-section height information is vital for evaluating the quality of the weld.
Extensive experiments have revealed that the varying shapes of welded steel rebar seams under different working conditions lead to variability in laser stripe images. Consequently, relying solely on the least squares polynomial fitting method is inadequate for identifying weld toe feature points in various lap welds. When the laser stripe image of a weld seam approximates a straight line, its feature points become indistinct, causing significant errors in feature point identification using the least squares polynomial fitting method. Furthermore, there are instances where the fitted fourth-degree polynomial curve fails to exhibit points where the curvature changes sign. Therefore, this paper proposes utilizing multi-modal image superimposition processing to accurately identify the final feature points.
2.1.2 Multi-modal image fusion for determining final feature points
The portable scanner captures two types of images: visible light images and laser images. The visible light images clearly visualize the welded areas of the rebar, aiding in the determination of final feature points. This paper leverages a lightweight U-Net architecture to segment regions of interest (ROI) in the multi-modal images, effectively overcoming the challenges posed by traditional segmentation algorithms on uneven, highly reflective surfaces.
When U-Net parameters are selected, multiple factors need to be considered comprehensively. Regarding the convolutional kernel size, a 3×3 convolutional kernel is commonly used as it strikes a good balance between capturing local features and computational efficiency. If a larger receptive field is desired, a 5×5 convolutional kernel can be attempted, though this will increase the computational load. The number of convolutional layers is also crucial. Generally, the number of convolutional layers in the encoder and decoder ranges from 3 to 5. Increasing the number of layers enhances the ability to capture complex features but may lead to overfitting. In terms of the number of channels, the channel count often doubles during the downsampling process in the encoder, for example, from 64 to 128, 256, etc., and decreases accordingly in the decoder. The specific number should be determined based on the complexity of the dataset and the difficulty of the task. The learning rate determines the step size of model parameter updates. If it is too large, the model may miss the optimal solution; if it is too small, the convergence speed will be slow. A learning rate decay strategy, such as cosine annealing decay, can be used to adjust the learning rate dynamically. The batch size refers to the number of samples input into the model during each training. A large batch size can enhance the stability of training but requires more memory, while a small batch size can increase the randomness of the model and help it escape local optima.
U-Net is a specialized convolutional neural network for image segmentation, characterized by its encoder-decoder architecture. It captures image features through down-sampling and restores spatial resolution via up-sampling. A key innovation of U-Net is its skip connections, which enable the network to merge high-resolution features from the encoding phase with those in the decoding phase. This design significantly enhances segmentation accuracy and detail preservation. The network is adaptable to input images of various sizes, producing segmentation results that match the input dimensions. U-Net excels in efficient feature extraction, leveraging skip connections, handling small sample sizes, and offering flexibility. The model structure is depicted in Fig. 9.
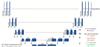 |
Fig. 9 U-Net network model |
To demonstrate U-Net’s advantages in weld seam segmentation, we conducted comparative simulations against the traditional threshold algorithm. In our tests, U-Net achieved 90% accuracy (correct segmentation rate), 85% recall rate (detection completeness), and a 0.87 F1 score. The F1 score, defined as the harmonic mean of precision and recall, reflects the balance between correctly identifying targets and minimizing missed detections. These metrics were derived exclusively from our controlled simulation environment, utilizing an internally generated dataset that was compiled from engineering field measurements and specifically designed for weld seam analysis. Given the historical reliance on manual methods and the scarcity of established algorithmic benchmarks in weld seam inspection, this comparison establishes an algorithmic baseline. In contrast, the traditional threshold segmentation algorithm has a segmentation accuracy of only 70%, a recall rate of 60%, and an F1 score of 0.65. These performance metrics were obtained through simulations of traditional threshold segmentation algorithm based on industry standards (e.g. JGJ 27 and JGJ 18) as reference benchmarks, since rebar weld inspection has currently relied on manual visual assessments[3-4]. In terms of running time, U-Net takes 10 s, while the traditional algorithm only takes 2 s. However, in scenarios with high requirements for segmentation accuracy, the advantages of U-Net are significant. This indicates that U-Net can identify the welding area more accurately, effectively avoiding missed detections and false alarms, and performing better in complex welding image segmentation tasks.
Figure 10 presents the captured raw visible light image alongside the welding area segmentation map generated by the U-Net network. The image on the left offers a detailed visual depiction of the welding area’s surface characteristics, capturing key geometric and textural features under natural lighting conditions. This serves as a crucial input for the segmentation process, enabling the precise delineation of the welding region while minimizing interference from surrounding structures. The image on the right clearly defines the boundaries of the welding area, providing a reliable reference for subsequent feature extraction and analysis.
 |
Fig. 10 Visible light image (a) and segmentation image (b) |
To address the issue of inaccurate feature points in individual laser images, we overlay the refined laser images with the segmentation results from visible light images. The intersections of the segmentation result edges with the laser stripes serve as the final feature points. The results of this multimodal image overlay processing are shown in Fig. 11. In this figure, the blue lines represent the edges of the welding segmentation area, the red lines indicate the centerlines of the laser stripes, and the intersections of the blue and red lines are the determined feature points. These feature points are then used to identify subsequent research locations.
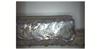 |
Fig. 11 Multimodal image fusion processing results |
2.2 Weld Thickness and Saturation Detection Method
The thickness of the weld is defined as the distance from the center of the rebar to the top of the weld. During laser stripe projection, geometric variations in the rebar can cause the laser stripes to appear intermittent. Additionally, the welding head itself has a certain diameter, which affects measurements and results in an actual weld thickness denoted as S1, as shown in Fig. 12. In this figure, the weld width is indicated by b, and the rebar dimension is indicated by d.
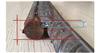 |
Fig. 12 Schematic diagram of actual weld thickness |
The methods for determining the highest point of the weld are as follows: First, preprocess the acquired multi-modal images to enhance the image contrast, thereby making the weld area clearer. Then, utilize the edge information to further optimize the edge contours and remove possible noise interference. After that, in the processed image, determine the highest point of the laser stripe within the weld area according to the deformation of the laser stripe and the geometric characteristics of the weld.
To determine the thickness of the weld, first, calculate the height difference between the highest point and the ground point among the characteristic points of the weld toe. Then, subtract the radius of the rebar from this height to obtain the weld thickness. The detection results for these characteristic points are illustrated in Fig. 13, where the yellow points indicate the highest point in the weld toe region and the ground point, respectively.
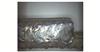 |
Fig. 13 Thickness feature point detection result diagram |
Partial defects in the weld, such as weld spatter, can be assessed by evaluating the weld saturation. This is typically determined by calculating the standard deviation of the thickness values, as shown in equation (1).
 (1)
(1)
where F represents the weld saturation, n is the number of thickness measurements, Si is the thickness at the i-th point, and  is the average thickness value.
2.3 Weld Length Detection Method
The length of a weld is a vital parameter in weld inspection. This measurement can be accurately obtained through endpoint recognition aided by a miniature rotary encoder. Figure 14 illustrates a schematic representation of the length of a lap joint weld in rebars, where the length of the weld is indicated by l.
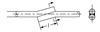 |
Fig. 14 Weld length diagram |
A portable scanner, equipped with a miniature rotary encoder, uses cyclic detection via a control chip to ensure that the visible light sequence images align with consistent pixel differences. This mechanism enables precise identification of weld endpoints. By counting the number of visible light sequence images and converting them through pixel equivalence calculations, the accurate length of the weld can be determined. To further analyze the weld image, a projection histogram can be employed. This technique involves projecting the image along a predetermined direction and accumulating the grayscale values along specific coordinates in that direction. Consequently, it enables the observation of the distribution of pixel grayscale values through a one-dimensional histogram.
Through extensive experimental observations, it has been ascertained that by initially identifying the peak-to-peak values within the projection histogram, and subsequently applying a scaling factor, the corresponding pixel values can be accurately calculated. The column pixel corresponding to the summation of these pixel values is then identified as the weld endpoint. Repeated experiments (50 times) have demonstrated that a scaling factor of 0.45 yields the minimal endpoint identification error. Figure 15 depicts the projection histogram for the right endpoint alongside the identification result of the segmented right endpoint. Correspondingly, Fig. 16 showcases the projection histogram for the left endpoint and the identification result of the segmented left endpoint.
 |
Fig. 15 Recognition result of the right weld endpoint (a) Projection histogram; (b) Segmentation image |
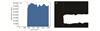 |
Fig. 16 Recognition result of the left weld endpoint (a) Projection histogram; (b) Segmentation image |
3 Experimental Validation
During experimental validation, the primary focus is on verifying both calibration accuracy and measurement accuracy of the system. Calibration accuracy directly affects measurement precision, with the light plane calibration being the main source of error. Conversely, measurement accuracy largely hinges on the detection accuracy of feature points. Significant discrepancies between the detected and actual coordinates of feature points can lead to considerable measurement errors. To validate detection accuracy, practical experiments are conducted using high-precision geometric measurement instruments, such as vernier calipers, followed by a comprehensive error analysis.
3.1 Calibration Accuracy Verification
The overall system calibration is performed using Matrix Laboratory (MATLAB). By using MATLAB’s built-in monocular vision calibration tool, 45 pre-collected images are imported for the calibration process, and results are outputted through code operations. As depicted in Fig. 17, the final reprojection error is only 0.12 pixels, signifying a minimal error rate that satisfies the requirements for portable devices.
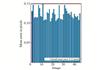 |
Fig. 17 Reprojection error map |
Once the camera parameters have been calibrated, the conversion between pixel coordinates and real-world 3D coordinates can be achieved, facilitating subsequent practical testing and research. In this study, standard gauge blocks of sizes 1 mm, 5 mm, and 8 mm were selected for testing. The results are presented in Table 1.
The measured mean values of the gauge blocks are approximately 1.071 8 mm, 5.062 4 mm, and 8.064 4 mm, respectively. The maximum error is less than 0.076 0 mm, and the standard deviation does not exceed 0.005 6 mm. The result meets the requirements of Technical Specification (JGJ 18-2012) for steel bar welds[3].
System calibration accuracy measurement results (unit:mm)
3.2 Measurement Accuracy Verification
Through practical experiments, rebar weld samples were selected for testing. By using tools such as vernier calipers for comparative measurements, the system’s measurement performance was verified for both reliability (repeated 50 times) and accuracy.
The results of the structured light measurement are illustrated in Fig. 18. The structured light image captured by the detection system at a fixed position is shown in Fig. 18(a). By judiciously selecting the exposure time of the industrial camera, the surrounding background is rendered relatively dark to enable clear positioning for consistent experimental tests. The extracted centerline and feature points of the weld light stripe are illustrated in Fig. 18(b). Subsequently, the laser stripe image is translated to the correct shooting position based on the pixel overlap difference determined by the micro rotary encoder.
 |
Fig. 18 Structured light measurement result (a) Raw laser stripe; (b) Centerline and feature shift |
The results of the visible light and overlay processing are presented in Fig. 19. Figure 19(a) illustrates the effect of overlaying the processed laser stripe image with the segmented image, while Fig. 19(b) shows the result of combining the segmented image with the translated laser image. This alignment verification is a critical prerequisite step, ensuring the accuracy and reliability of the subsequent extraction of weld morphology data.
 |
Fig. 19 Overlay processing results of laser stripe and segmented images (a) Visible-light image; (b) Segmentation-laser fusion |
The system’s visualized measurements and the actual test results obtained with the vernier caliper are presented in Fig. 20. Specifically, Fig. 20(a) shows the final visualization, while Fig. 20(b) displays the measurement results from the vernier caliper.
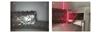 |
Fig. 20 System visualization results and reference measurement comparison (a) Visualization result; (b) Caliper measurement |
A stability test was conducted on the same measurement points of the steel reinforcement weld, repeated 50 times. The measurement error for weld width did not exceed 0.120 0 mm, with a mean square deviation of 0.000 7 mm. Similarly, the measurement error for weld thickness did not exceed 2.430 0 mm, with a mean square deviation of 0.015 6 mm. These results demonstrate significant improvement over conventional manual inspection methods referenced in industry standards (e.g. JGJ 27 and JGJ 18), where extensive field experience indicates error ranges of 0.1-0.5 mm[3-4]. Overall, the measurements demonstrated high stability and minimal fluctuations.
When extracting the center of the light stripe, the U-Net deep network is first used for rough extraction of multi-line structured light stripes. During the implementation process, certain stripe segmentation errors will occur, which in turn affects the extraction accuracy of feature points.
4 Conclusion
This paper introduces a portable rebar weld detection device based on multi-modal visual scanning. The system is centered around the STM32 microcontroller, which serves as the main control unit. It functions by driving an industrial camera for image acquisition, controlling the switches of the laser and ring supplementary lighting, and transmitting commands via the UDP. The device utilizes a configuration with an inclined laser and a directly incident industrial camera, enabling the detection of key weld indicators, including width, thickness, saturation, and length. A visualization software application was developed using Microsoft Visual Studio 2017 and the MFC framework, facilitating the reception, display, and storage of image data. By leveraging the entropy weight method, a weld quality evaluation system was proposed to assess the quality of welded workpieces. The evaluation results are automatically saved in file format, ensuring the digital archiving of assessment data. This system supports highly automated, rapid, and non-contact weld measurement on-site, significantly enhancing the detection quality of rebar welds and the objective supervision and evaluation of welding quality at construction sites.
Future research will focus on improving the acquisition stability of the device, optimizing image processing algorithms, and further enhancing the robustness of the portable rebar weld evaluation device.
References
- Lu C F. Research on Post-Weld Inspection Technology Based on Laser Vision Sensing[D]. Harbin: Harbin Institute of Technology, 2007(Ch). [Google Scholar]
- He Z X. Appearance quality inspection of steel structure welds[J]. Architectural Engineering Technology and Design, 2016, 14(2): 1668(Ch). [Google Scholar]
- Ministry of Construction of China. Standard for Test Methods of Steel Bar Welding Joints: JGJ/T27-2001 J140-2001[M]. Beijing: China Architecture & Building Press, 2001 (Ch). [Google Scholar]
- Ministry of Construction of China. Code for Acceptance of Steel Bar Welding: JGJ18-2012, Code for Acceptance of Steel Bar Welding[M]. Beijing: China Build Ind Press, 2012(Ch). [Google Scholar]
- Wu C T, Wang D L, Li H Q. Research and application of weld seam dimension calculation formula[J]. Coal Mine Mach, 2002, 2(5):42-43(Ch). [Google Scholar]
- Wang C X, Wang L, Sun C L, et al. Phased array B-scan acoustic field simulation of aluminum extrudate FSW welds with complex shapes[C]//2014 IEEE Far East Forum on Nondestructive Evaluation/Testing. New York: IEEE, 2014: 89-92. [Google Scholar]
- Wu S K. Research on X-Radiographic Test and Ultrasonic Test of the Fusion-Butt Welds of Polyethylene Gas Pipe[D]. Guangzhou: South China University of Technology, 2014(Ch). [Google Scholar]
- Gu X P. Study on Ultrasonic Testing for Laser Welded Lap Joint of Thin Stainless-Steel Sheet[D]. Jilin: Jilin University, 2013(Ch). [Google Scholar]
- Yang G F. Research on Intelligent Analysis Method for Welding Quality Based on X-Ray Imaging[D]. Daqing: Northeast Petroleum University, 2014(Ch). [Google Scholar]
- Wang Y G, He H T, Liu S, et al. Application of visual inspection technology in weld detection[J]. Modern Machinery, 2005, 30(2): 63-64, 67(Ch). [Google Scholar]
- Wang P. Research on Key Technologies of Linear Structured Light 3D Automatic Scanning System[D]. Tianjin: Tianjin University, 2008(Ch). [Google Scholar]
- Zhao S. Research on 3D Scanning Detection Technology and Evaluation Method of Steel Bar Weld Seam[D]. Xi’an: Chang’an University, 2019(Ch). [Google Scholar]
- White R A, Lucas J, Smith J S. Vision-based gauge for online weld profile metrology[J]. IEE Proceedings—Science, Measurement and Technology, 1994, 141(6): 521-526. [Google Scholar]
- Cook G E, Barnett R J, Andersen K, et al. Automated visual inspection and interpretation system for weld quality evaluation[C]//IAS’95: Conference Record of the 1995 IEEE Industry Applications Conference 30th IAS Annual Meeting. New York: IEEE, 1995: 1809-1816. [Google Scholar]
- Noruk J. Visual weld inspection enters the new millennium[J]. Sensor Review, 2001, 21(4): 278-282. [Google Scholar]
- Lee J, Im P, Park Y, et al. Welding bead and chamfer inspection by means of laser vision[C]//Proceedings of SPIE—The International Society for Optical Engineering. Boston: SPIE, 2001: 41-50. [Google Scholar]
- Jablonski R, Turbowski M, Szewczyk R. Recent Advances in Mechatronics[M]. Berlin: Springer-Verlag, 2007: 258-262. [Google Scholar]
All Tables
All Figures
|
Fig. 1 Typical defects in rebar welds |
| In the text | |
|
Fig. 2 Flowchart of weld detection |
| In the text | |
|
Fig. 3 System structure diagram |
| In the text | |
|
Fig. 4 System overall architecture diagram |
| In the text | |
|
Fig. 5 Hardware system construction |
| In the text | |
|
Fig. 6 Curve fitting region |
| In the text | |
|
Fig. 7 Curve fitting results |
| In the text | |
|
Fig. 8 Preliminary feature points |
| In the text | |
|
Fig. 9 U-Net network model |
| In the text | |
|
Fig. 10 Visible light image (a) and segmentation image (b) |
| In the text | |
|
Fig. 11 Multimodal image fusion processing results |
| In the text | |
|
Fig. 12 Schematic diagram of actual weld thickness |
| In the text | |
|
Fig. 13 Thickness feature point detection result diagram |
| In the text | |
|
Fig. 14 Weld length diagram |
| In the text | |
|
Fig. 15 Recognition result of the right weld endpoint (a) Projection histogram; (b) Segmentation image |
| In the text | |
|
Fig. 16 Recognition result of the left weld endpoint (a) Projection histogram; (b) Segmentation image |
| In the text | |
|
Fig. 17 Reprojection error map |
| In the text | |
|
Fig. 18 Structured light measurement result (a) Raw laser stripe; (b) Centerline and feature shift |
| In the text | |
|
Fig. 19 Overlay processing results of laser stripe and segmented images (a) Visible-light image; (b) Segmentation-laser fusion |
| In the text | |
|
Fig. 20 System visualization results and reference measurement comparison (a) Visualization result; (b) Caliper measurement |
| In the text | |
Current usage metrics show cumulative count of Article Views (full-text article views including HTML views, PDF and ePub downloads, according to the available data) and Abstracts Views on Vision4Press platform.
Data correspond to usage on the plateform after 2015. The current usage metrics is available 48-96 hours after online publication and is updated daily on week days.
Initial download of the metrics may take a while.