| Issue |
Wuhan Univ. J. Nat. Sci.
Volume 30, Number 4, August 2025
|
|
|---|---|---|
| Page(s) | 367 - 378 | |
| DOI | https://doi.org/10.1051/wujns/2025304367 | |
| Published online | 12 September 2025 | |
CLC number: TP212
The Calibration Method of Line Structured Light Sensor for Integrated Position and Pose Detection of Highway Guardrail Inspection Robots
用于高速公路护栏检测机器人一体化位姿检测的线结构光传感器标定方法
1
Research Institute of Highway Science, Ministry of Transport, Beijing 100088, China
2
School of Information Engineering, Chang'an University, Xi'an
710064, Shaanxi, China
3
School of Electronic and Control Engineering, Chang'an University, Xi'an
710064, Shaanxi, China
Received:
18
December
2024
Abstract
The accuracy of center height detection for corrugated beam guardrails is significantly affected by robot posture in the mobile highway guardrail detection systems based on structured light vision. To address the problem, this paper proposes an integrated calibration method for structured light vision sensors. In the proposed system, the sensor is mounted on a crawler-type mobile robot, which scans and measures the center height of guardrails while in motion. However, due to external disturbances such as uneven road surfaces and vehicle vibrations, the posture of the robot may deviate, causing displacement of the sensor platform and resulting in spatial 3D measurement errors. To overcome this issue, the system integrates inertial measurement unit (IMU) data into the sensor calibration process, enabling real-time correction of posture deviations through sensor fusion. This approach achieves a unified calibration of the structured light vision system, effectively compensates for posture-induced errors, and enhances detection accuracy. A prototype was developed and tested in both laboratory and real highway environments. Experimental results demonstrate that the proposed method enables accurate center height detection of guardrails under complex road conditions, significantly reduces posture-related measurement errors, and greatly improves the efficiency and reliability of traditional detection methods.
摘要
为了解决在基于结构光视觉的移动式公路护栏检测系统中,机器人姿态对波形梁护栏中心高度检测精度造成显著影响的问题,本文提出了一种结构光视觉传感器的集成标定方法。在所提出的系统中,传感器安装在履带式移动机器人上,机器人在运动过程中对护栏进行扫描和测量,以获取其中心高度。然而,由于不平整路面和车辆振动等外部干扰因素,机器人姿态可能发生偏移,导致传感器平台发生位移,从而产生三维空间测量误差。为解决这一问题,系统将惯性测量单元(IMU)的数据集成到传感器标定过程中,通过传感器融合实现实时姿态偏差校正。该方法实现了结构光视觉系统的统一标定,有效补偿了姿态引起的误差,提高了检测精度。本文开发了系统原型,并在实验室和真实高速公路环境中进行了测试。实验结果表明,所提出的方法在复杂道路条件下能够实现护栏中心高度的高精度检测,显著降低姿态相关测量误差,大幅提升了传统检测方法的效率与可靠性。
Key words: highway corrugated guardrail / structured light visual scanning / structured light sensor calibration / guardrail detection robot / robot motion posture parameters
关键字 : 高速公路波形护栏 / 结构光视觉扫描 / 结构光传感器标定 / 护栏检测机器人 / 机器人运动姿态参数
Cite this article: WANG Rui, BAI Jiadi, XUE Yingqi, et al. The Calibration Method of Line Structured Light Sensor for Integrated Position and Pose Detection of Highway Guardrail Inspection Robots[J]. Wuhan Univ J of Nat Sci, 2025, 30(4): 367-378.
Biography: WANG Rui, female, Associate researcher, research direction: transportation engineering. E-mail: This email address is being protected from spambots. You need JavaScript enabled to view it.
Foundation item: Supported by the Special Fund for Basic Scientific Research of Central-Level Public Welfare Scientific Research Institutes (2024-9007)
© Wuhan University 2025
 This is an Open Access article distributed under the terms of the Creative Commons Attribution License (https://creativecommons.org/licenses/by/4.0), which permits unrestricted use, distribution, and reproduction in any medium, provided the original work is properly cited.
0 Introduction
With the extension of the service life of highway infrastructure and the increase in transportation volume, the aging of infrastructure along the route and the decrease in protective effectiveness directly threaten traffic safety[1-2]. As the infrastructure of highway traffic, crash barriers have the functions of delineating safe driving areas for vehicles, preventing vehicles from losing control and rushing off the road, protecting passengers, and reducing accident injuries[3]. However, the long-term exposure of guardrails, daily wear and tear, and traffic accident impacts over the years can lead to structural damage. In addition, frequent road surface repairs for road diseases over the long term have resulted in a decrease in the height of the guardrail center to the ground[4]. These factors can all damage the service life and protective performance of guardrails, leading to accidents such as riding over and overturning guardrails when vehicles collide[5]. Therefore, regular inspections, maintenance, and necessary repairs of in-service guardrails are necessary steps to ensure their proper functioning in the road traffic system.
At present, the traditional method for detecting guardrail parameters adopts manual inspection, which involves manually holding measuring instruments to measure along the line. This method has low operational efficiency, long cycle times, high cost, and significant safety hazards. In addition, the measurement results are manually recorded, and long-term repetitive work can easily lead to fatigue, which may result in a series of errors or mistakes[6], leading to incorrect or untimely information reporting. It can be seen that with the continuous expansion of highway mileage, traditional manual inspection methods are no longer able to meet the huge demand for future transportation infrastructure inspection and maintenance.
Early research on guardrail parameter detection technology mainly focused on the depth of column burial. In 2008, He et al[7] proposed a method for detecting the burial depth of highway guardrail columns by analyzing the propagation characteristics of ultrasonic guided waves in guardrail columns, laying a solid foundation for non-destructive quality inspection of columns. Between 2010 and 2012, Jia et al[8-9] conducted extensive research on the detection of buried depth of highway guardrail columns using elastic waves. By applying knowledge of elastic dynamics, the propagation characteristics of elastic waves at different frequencies were analyzed under the conditions of column burial depth and non-burial depth. In 2022, Hu et al[10] designed a stress wave reflection period extraction method based on image processing to achieve high-precision detection of column burial depth, with an average measurement error of less than 5%. However, these detection methods require carrying a large number of devices, and after the detection is completed, it is necessary to synchronize the detection data of each device, greatly reducing the detection efficiency.
To achieve automated inspection of guardrails, scholars have successively researched automatic inspection technologies such as machine vision and mobile mounting devices. Based on the research of Broggi et al[11-13] on the relevant technology of guardrail target detection in autonomous driving, Wang et al[14] collected guardrail images on both sides of the railway through a train mounted image processing and recognition device, and proposed a high-speed railway line guardrail integrity automatic detection method based on machine vision technology. Based on previous research, Li et al[15] proposed an automatic detection of guardrail deformation and high-speed mileage positioning method based on binocular vision for highway guardrail deformation and mileage positioning, providing a safe, efficient, and low-cost solution for daily inspection operations of guardrails. In 2023, Ni[16] proposed a deep learning-based algorithm for detecting deformation of guardrails in complex backgrounds. The overall accuracy of the algorithm's deformation guardrail detection rate is 92.9%, which can accurately detect deformation waveform guardrail samples. However, there are some cases of missed or false detections. At present, guardrail detection technology mainly focuses on areas such as column burial depth and guardrail deformation. In contrast, detection technology for guardrail center height under complex vegetation backgrounds is relatively scarce. Therefore, there is an urgent need to conduct research on automated non-destructive testing technology for guardrail structural parameters.
This article focuses on the parameter detection of waveform guardrails and proposes a parameter detection system for highway guardrails under complex backgrounds based on line structured light scanning, integrating two different specifications of guardrail plate shapes. The key technologies, such as complex vegetation background processing algorithms and light strip fracture repair fitting algorithms, are studied in detail. Ultimately, automated and continuous measurement of the shape, deformation, inclination, and center height of guardrail panels under complex backgrounds was achieved, providing a foundation for digital documentation of guardrails. This is of great significance for daily maintenance and parameter tracing in the later stage.
1 A Robot System for Detecting the Center Height of Highway Waveform Guardrails Based on Structured Light
1.1 Testing Object and Requirement Analysis
As shown in Fig. 1, waveform guardrail panels are usually divided into two waveforms and three waveforms. According to the Design Rules for Highway Traffic Safety Facilities, the specifications of the two types of guardrail panels are shown in Fig. 2. Among them, the center height, deformation, and inclination of the guardrail directly affect its protective performance[17-18].
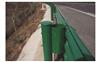 |
Fig. 1 Corrugated beam guardrail standard structure and guardrail specifications |
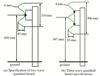 |
Fig. 2 Specifications of corrugated guardrail plate |
This study utilizes line structured light vision technology to detect the shape, deformation, inclination, and center height of guardrail panels, and uses a tracked robot platform equipped with structured light vision sensors to conduct inspections using the guardrail parameters of the robot's line movement team.
1.2 Composition of a Structured Light Scanning Autonomous Cruise Barrier Detection Robot System
Our team has independently developed an intelligent tracked style operation robot mobile carrier, equipped with a self-designed structured light vision sensor, an industrial computer, and other hardware components, to achieve multi-parameter intelligent detection of highway guardrails.
As shown in Fig. 3, the chassis of the operation robot is equipped with a track-type assembly, laser radar, motor, and attitude sensor, and can walk along the guardrail in the safe area of the emergency lane. The robot installation system mainly consists of structured light vision sensors and industrial control computers. As the control core of the system, industrial control computers collect light strip images from structured light vision sensors during the operation process, and perform real-time data analysis and model calculations. The digital filing and management platform is used to manage the measurement data of the system. Based on the overall plan of the system, the structure of the system was constructed, as shown in Fig. 4.
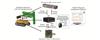 |
Fig. 3 Architecture diagram of the highway guardrail parameter detection operation robot |
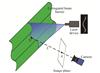 |
Fig. 4 Principle of structured light visual inspection |
When the operation robot passes through each column, it sends information such as the column number and its status to the industrial computer. The industrial computer controls the camera to capture light bar images based on this information and performs real-time image processing. Combined with system calibration parameters and posture data of the carrying operation robot, the actual parameters of the guardrail are calculated. Subsequently, the measurement results and robot status data are packaged and transmitted to the computer via wireless radio. The digital archiving and management platform running on the computer completes functions such as archiving, querying, and analyzing measurement data.
1.3 Vehicle-Mounted Structured Light Vision Sensor
The vehicle-mounted structured light visual sensor is the core part of the visual inspection system, which consists of a camera, lens, laser, and filter. It has the advantages of a simple structure, strong anti-interference ability, and high measurement accuracy. Laser is usually used as an auxiliary light source, combined with image processing and system calibration for detection. The principle involves projecting a ray-shaped light strip in the direction perpendicular to the guardrail using a laser. The image acquisition camera and the laser projection direction are positioned at a certain angle. The distortion of the light strip projected onto the guardrail is collected to obtain the three-dimensional shape structure parameters of the guardrail. The characteristics of the light strip are analyzed through image processing algorithms to identify the shape and deformation of the guardrail plate, and the actual inclination and center height are obtained by combining calibration parameters. The principle of structured light visual inspection is shown in Fig. 4.
According to the incident mode of the laser, the structure of the sensor can be divided into direct beam and oblique beam modes. This robot system adopts a direct beam structure. This structure is relatively simple. The laser is vertically projected onto the surface of the object, and the camera captures the diffuse reflection light strip image of the surface at a certain angle. This system has the advantages of small size and easy calibration. The angle between incident light and reflected light has an impact on measurement sensitivity and system volume[19].To determine reasonable sensor structural parameters, it is necessary to determine the angle between the laser projection direction and the camera optical axis. This article analyzes the direct beam path and determines the angle between the laser projection direction and the camera optical axis. The direct beam path diagram is shown in Fig. 5.
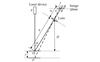 |
Fig. 5 Optical path diagram of direct-beam structure |
This article designs a sensor structure for fixing visual components by setting the angle between the laser projection direction of the sensor and the camera optical axis at 35° and the baseline distance between the laser and the camera at 27 cm. By encapsulating the sensor, the stability and integrity of the structure are ensured, and the structure of the sensor fixture is shown in Fig. 6. This system utilizes a robot-driven structured light vision sensor to achieve long-distance scanning of guardrail panels. During this process, the relative pose relationship between the camera and laser, sensor bracket, and vehicle body remains unchanged[20].
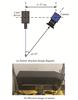 |
Fig. 6 Structure diagram of sensor fixture |
2 Structural Light Vision Scanning Sensor Guardrail Center Height Detection Model
2.1 Camera Projection Model
In visual inspection systems, camera projection models based on perspective imaging are used to map 3D spatial points to 2D image pixels through transformations among multiple coordinate systems. While traditional models assume a fixed camera pose, this study introduces an integrated calibration method that fuses inertial measurement unit (IMU)-based posture data into the camera projection model, enabling dynamic correction of sensor orientation during guardrail detection. The overall projection framework is illustrated in Fig. 7.
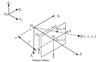 |
Fig.7 Camera projection model |
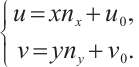
Let's establish a pixel coordinate system  with point
  in the upper left corner of the image plane as the origin, and measure it in pixels. Establish an image coordinate system
  with the intersection point
  between the camera optical axis and the imaging plane as the origin. Its X and Y axes are parallel to the U and V axes, respectively, and its measurement unit is millimeters. Assuming that the projection point of a point Q in space on the imaging plane is q, its coordinates in the pixel coordinate system and the image coordinate system are
  and
and  , and the coordinates of
  in the pixel coordinate system are
  , and the number of pixels contained in a unit physical length is
  and
and  , respectively, the relationship between q in the pixel coordinate system and the image coordinate system can be expressed as:
 (1)
(1)
The matrix form of equation (1) is expressed as follows:
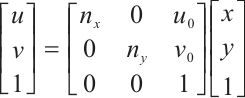 (2)
(2)
We establish a camera coordinate system  with the optical center of the camera lens as the origin
  , with its
  and
and  axes parallel to the X and Y axes of the image coordinate system, and the
  axis along the camera optical axis direction. Assuming that the coordinates of Q in the camera coordinate system are
  F, the corresponding coordinates of the projection point q in the image coordinate system are
  , and the lens focal length is
  , according to the trigonometric relationship, the mapping relationship between Q and q can be obtained:
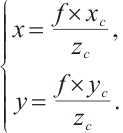 (3)
(3)
After expanding to homogeneous coordinates and converting to matrix form, we can obtain:
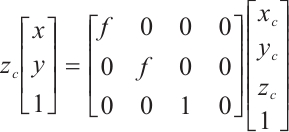 (4)
(4)
The world coordinate system  and the camera coordinate system
 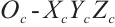 can be converted to each other through rotation and translation. Assuming that the coordinates of point Q in the world coordinate system and the camera coordinate system are
  and
and  D, respectively, their relationship can be expressed as:
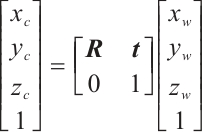 (5)
(5)
In the equation, R represents the rotation matrix of  , and t represents the translation vector of
  . By combining equations (2), (3), and (4), the relationship expression between the pixel coordinate system and the world coordinate system can be obtained:
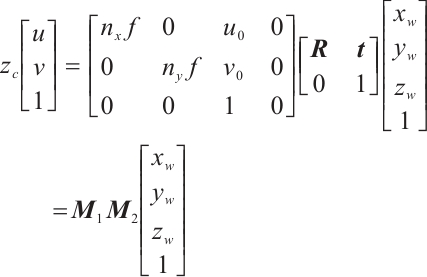 (6)
(6)
From equation (6), it can be seen that the system model is determined by two matrices,  and
and  . Matrix
  is called the internal parameter matrix, which contains the internal parameters of the camera, and matrix
  is called the external parameter matrix. When the camera position changes, matrix
  will also change accordingly.
2.2 Structural Light Vision Sensor Detection Model
The line-structured light visual inspection system requires obtaining the three-dimensional coordinates of feature points located on the light strip in the camera coordinate system. Therefore, a structured light visual sensor model needs to be established, as shown in Fig. 8.
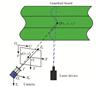 |
Fig. 8 Detection model of structured light vision sensor |
In the figure,  represents camera coordinates,
  represents image coordinate system,
  represents pixel coordinate system, and
  represents camera focal length.
  is any point on the light bar, with coordinates
  F in camera coordinates, and q is the projection point of point Q on the camera imaging plane, with coordinates
  . The conversion relationship between the pixel coordinate system and camera coordinate system can be obtained from the camera projection model as follows:
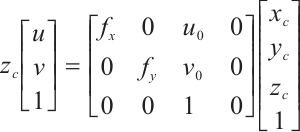 (7)
(7)
Equation (7) alone cannot uniquely map the two-dimensional image point  in the pixel coordinate system to the three-dimensional coordinate
  in the camera coordinate system. It is necessary to establish the plane equation of the structured light plane in the camera coordinate system to eliminate the ambiguity caused by introducing homogeneous coordinates. Let the expression of the light plane in the camera coordinate system be:
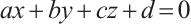 (8)
(8)
We combine equations (7) and (8) to establish a mathematical model for the visual sensor, as shown in equation (9).
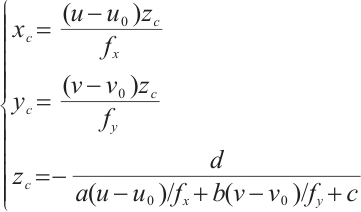 (9)
(9)
Based on this model, the three-dimensional spatial coordinates of any point on the light bar in the image can be calculated in the camera coordinate system.
3 Calibration Method for Center Height Measurement of Vehicle-Mounted Structured Light Guardrail Based on IMU
3.1 Structural Light Scanning Detection Model for Vehicle-Mounted Operation Robot
To analyze the posture information of the guardrail detection robot during operation, a structured light scanning robot model needs to be established. The conversion relationship between the robot coordinate system and the camera coordinate system should be derived. Then, based on the starting point of the robot's pole and the camera center as the coordinate origins, determine the specific positions of these two coordinate systems, as shown in Fig. 9.
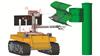 |
Fig.9 Coordinate system model of structured light scanning robot |
 is the vehicle chassis coordinate system, with the sensor bracket and robot connection center as the coordinate origin
  . The robot's forward direction is the positive
  -axis direction, and the upward direction perpendicular to the vehicle body is the positive
  -axis direction, thus establishing a right-handed coordinate system; E
 is the camera coordinate system, which takes the optical center of the camera lens as the origin
  , the optical axis direction as the positive
  direction, and the downward direction perpendicular to the camera surface as the positive
  axis, establishing a right-handed coordinate system.
Due to the fixed connection of structured light vision sensors to the robot body, there is a rigid coordinate translation and rotation relationship between the camera coordinate system and the robot coordinate system. There is a point  on the structured light plane in Fig. 7. Let its coordinate in the camera coordinate system be
  , and convert it to the coordinate in the robot coordinate system as
  . The relationship between the two is as follows:
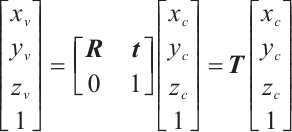 (10)
(10)
Among them,  represents the transformation matrix from the camera coordinate system to the robot coordinate system, which is the homogeneous transformation matrix of
  , composed of the rotation matrix
  of
of  and the translation vector
  of
of  .
.
3.2 Analysis of Measurement Error Caused by Vehicle Chassis Attitude
During the movement of robots, the body posture in space may deviate due to uneven road surfaces, obstacle crossings, and vehicle structures. The structured light vision sensor, connected to the vehicle body through a bracket, will also deviate along with the robot, ultimately causing the robot's coordinate system to shift and increasing the error in guardrail parameter detection. Therefore, calibration of the detection data is required[21-22]. As shown in Fig. 10, the robot experienced roll vibration during the detection process, causing the camera optical axis and the robot body to deviate from the horizontal plane, resulting in detection errors.
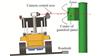 |
Fig.10 Schematic diagram of robot attitude deviation |
3.3 Chassis Posture Calibration Model for Operation Robots
This article uses IMU attitude sensors installed on the vehicle chassis to obtain the deflection angle of the actual posture of the vehicle chassis relative to each axis of the world coordinate system, in order to compensate for the errors introduced by the vehicle posture. Among them, it involves the world coordinate system 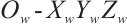 , camera coordinate system
  , robot coordinate system
  , and measurement coordinate system
  . The definition of the coordinate system is shown in Fig. 11.
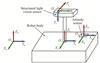 |
Fig.11 Coordinate system definition diagram |
The definitions of the camera coordinate system and robot coordinate system are the same as above. The world coordinate system  is the reference coordinate system for attitude sensors, which is established on an ideal horizontal ground and satisfies the setting method of "northeast sky" for each axis direction. The measurement coordinate system
 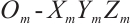 is established on a fixed attitude sensor inside the vehicle body, with the center of the attitude sensor as the origin, and the directions of each axis are consistent with the world coordinate system.
The attitude sensor can obtain the attitude angles of the measurement coordinate system relative to various axes of the world coordinate system, where the pitch angle  is along the
  -axis, the roll angle
  is along the
  -axis, and the yaw angle
  is along the
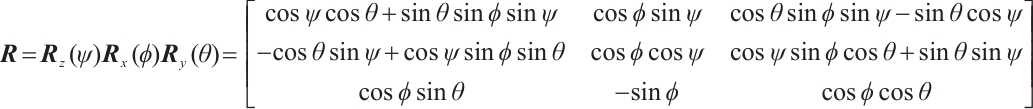
  -axis, which are regarded as the attitude angles of the robot. The rotation direction of the angles is defined according to the right-hand rule. When the robot's posture deviates, the robot's coordinate system will also deviate accordingly. Let the ideal coordinate system be the one before deviation, and the actual coordinate system be the other one after deviation. The two can be converted to each other through a rotation matrix. According to the setting method of the robot coordinate system "right front top" in this article, the Euler angle rotated in the order of "ZXY" matches the attitude angle. Therefore, the rotation matrix R can be expressed as:
 (11)
(11)
In the formula,  ,
,  , and
, and  are the rotation matrices corresponding to the rotation angles of
  ,
,  , and
, and  around the X, Y, and Z axes, respectively.
In order to compensate for the errors caused by the robot's attitude deviation, the pitch angle  , roll angle
  , and yaw angle
  collected by the attitude sensor are used to convert the data output in the robot coordinate system after deviation back to the data output in the ideal coordinate system relative to horizontal. If a point
  in the ideal robot coordinate system has coordinates P
 in the actual robot coordinate system, then
 (12)
(12)
When calculating the inclination and center height parameters of the guardrail panel, equations (11) and (12) can be used to convert the coordinates of the corresponding parameter feature points from the actual robot coordinate system to the ideal robot coordinate system, so as to facilitate the calculation, and thereby compensate for the errors caused by the robot's pose offset from the horizontal plane.
4 Error Analysis and Test Results
4.1 Testing Prototype Construction
To verify the feasibility and accuracy of the detection system, a prototype of hardware, including robots, industrial computers, cameras, lasers, and wireless radios, was built for guardrail parameter detection experiments. The system prototype is shown in Fig. 12.
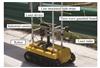 |
Fig. 12 System prototype |
In this system, the laser and camera are fixed together through a fixture. The structured light emitted by the laser is vertically projected onto the surface of the guardrail board. The camera is used to capture images of the guardrail board with light strips, and the LiDAR (LightLaser Detection and Ranging) is used to detect the distance between the robot and the guardrail board. In the experiment, the robot performs tracking motion along the guardrail board, and the camera captures dynamic images of the guardrail board light strip at regular intervals. The industrial computer processes the light strip images captured by the camera in real time, recognizes the shape and deformation of the guardrail board, calculates the inclination and center height, and uploads the detection data to the data platform. To ensure the effective operation of the system, the prototype was adjusted and configured as follows:
1) Adjust the position of the activity pole and LiDAR to a distance of 200 mm from the guardrail surface, ensuring that the LiDAR is perpendicular to the guardrail surface and at an appropriate distance.
2) Adjust the height of the sensor bracket so that the camera center is aligned with the center position of the guardrail panel, and set the relevant parameters at this height to the visual inspection software.
3) Adjust the focus and exposure parameters of the camera to ensure clear imaging of the light strip and improve specular reflection.
4.2 Integrated Calibration Experiment
To verify the effectiveness of the proposed robot posture calibration model, a controlled experiment was conducted focusing on the center height measurement of guardrail panels. The structured light vision system and the IMU-based correction algorithm were deployed on a crawler-based mobile detection robot prototype.
In the experiment, ten distinct posture configurations of the robot were created by manually adjusting the chassis tilt, simulating disturbances caused by uneven roads and motion-induced vibrations. At each pose, the robot's pitch, roll, and yaw angles were recorded using the onboard IMU sensor. Meanwhile, the structured light sensor captured light strip images of the guardrail panel.
For each posture, the center height was calculated using the proposed algorithm both before and after applying the posture correction model. The manually measured center height under ideal horizontal conditions was used as the reference value for evaluating measurement error.
4.3 Robot Attitude Calibration Experiment
The experimental results, including the recorded attitude angles and the corresponding center height errors, are summarized in Table 1. The table compares the measurement errors before and after applying the robot posture calibration.
To further assess calibration effectiveness, a statistical analysis of the absolute center height errors was conducted. The results are presented in Table 2.
As shown in Table 2, the average absolute error was significantly reduced after applying the proposed posture correction model, from 16.741 mm to 2.610 mm. This demonstrates that the integration of IMU posture information effectively improves the accuracy and robustness of structured light-based guardrail detection under non-ideal movement conditions.
Experimental data on attitude angle and error before and after correction
Experimental results of robot attitude correction (unit:mm)
4.4 Field Experiment
At present, the working requirements of the detection robot system have been fully implemented, and multiple-stage functional testing and acceptance have been carried out at the Chang'an South Expressway. In order to verify the efficiency and detection accuracy of the image processing algorithm designed in this article, a guardrail plate parameter detection system experiment was conducted at the guardrail experimental site of our school.
This experiment selected 5 sections of three waveform guardrails with complex vegetation background interference. Each sampling point is sampled three times using the image processing algorithm without background removal and the image processing algorithm proposed in this paper, and the average value is taken. At the same time, manual measurements are taken at the inspection points of each section of the guardrail. Comparing the actual value of the center height measured by a handheld ruler with two machine measurements, the center height measurement results of the waveform beam guardrail crossbeam shown in Fig. 13 are obtained.
 |
Fig. 13 Comparison test results of the beam center height |
The trend of changes in the measured height of the system center is consistent with the true value. The measurement error of the center height of the guardrail board is between 1.137 mm and 4.387 mm. The relative error between the measured value and the true value was calculated separately, and the results showed that the relative error of the center height measurement was less than 1%, achieving good measurement results and verifying the accuracy and reliability of the center height detection algorithm.
Due to manual errors and the influence of attitude deviation, the results of the following three different detection methods are compared. Figure 13 presents a comparative analysis of the measured center height values obtained through three different methods: (1) manual measurement using a ruler (considered as the reference true value), (2) structured light vision detection without attitude correction, and (3) structured light vision detection using the proposed background attitude correction algorithm. The figure shows the center height measurement results across five different sections of waveform guardrails under complex environmental conditions.
From the graph, it can be observed that the measurements obtained using the proposed method are significantly closer to the manually measured reference values compared to the unprocessed structured light data. This indicates that the attitude correction algorithm effectively suppresses the influence of attitude deviation on the light strip extraction process.
In addition, the measurement errors using the proposed method are within a range of 1.137mm to 4.387mm, with a relative error consistently below 1%. This demonstrates the high precision and robustness of the system under real-world conditions. The improved measurement stability not only verifies the effectiveness of the algorithm but also confirms the feasibility of deploying the integrated detection system in actual highway environments for large-scale, automated inspection tasks.
5 Conclusion
According to the requirements of guardrail parameter detection, research has been carried out on a highway anti-collision guardrail parameter detection robot system, and a set of highway guardrail plate parameter detection systems based on line structured light scanning has been designed. The main achievements include:
(1) An integrated calibration method based on structured light vision and IMU data was proposed to correct posture-induced errors in guardrail center height detection, effectively improving measurement accuracy under complex conditions.
(2) We designed a detection scheme for guardrail parameters based on the principle of structured light visual scanning detection. The camera, structured light plane equation, and robot system calibration principles and methods were elaborated in detail. An integrated calibration experiment was conducted using a checkerboard pattern to obtain the conversion relationship between pixel coordinates and robot coordinates. The future research direction and focus will be to use the calibrated line structured light sensor combined with an industrial camera for image acquisition and processing, as well as to detect guardrail-related defects and structural parameters.
References
- Chen Y, Salike N, Luan F S, et al. Heterogeneous effects of inter- and intra-city transportation infrastructure on economic growth: Evidence from Chinese cities[J]. Cambridge Journal of Regions, Economy and Society, 2016, 9(3): 571-587. [Google Scholar]
- National Bureau of Statistics. Statistical Communiqué of the People's Republic of China on the 2022 National Economic and Social Development[N]. China Information News, 2023-03-01(001)(Ch). [Google Scholar]
- Teng T L, Liang C C, Hsu C Y, et al. Effect of soil properties on safety performance of W-beam guardrail[C]//Proceedings of the 2016 International Conference on Advanced Materials Science and Environmental Engineering. Atlantis Press, 2016: 34-36. [Google Scholar]
- Jing D F, Kang K X, Song C C. Research on the retrofit proposal of W-beam guardrail[J]. Highway Engineering, 2021, 46(1): 117-124(Ch). [Google Scholar]
- Xie T L, Ren Q, Wu Z J, et al. Study on structural design and safety performance of new corrugated beam barrier[J]. Highway, 2022, 67(7): 343-346(Ch). [Google Scholar]
- Razmjooy N, Mousavi B S, Soleymani F. A real-time mathematical computer method for potato inspection using machine vision[J]. Computers & Mathematics with Applications, 2012, 63(1): 268-279. [Google Scholar]
- He C F, Wang X P, Wang X Y, et al. Inspection of expressway guardrail post length partly embedded in soil based on ultrasonic guided wave technology[J]. China Journal of Highway and Transport, 2008, 21(6): 37-42(Ch). [Google Scholar]
- Jia Z X, Chen Y H, Zhao X, et al. Research on the inspection method of expressway guardrail post embedded depth based on elastic wave technique[J]. Journal of Highway and Transportation Research and Development, 2010, 27(11): 127-131(Ch). [Google Scholar]
- Jia Z X, Zhang X, Zhao X, et al. Research on influence factors and NDT technology of expressway barrier post embedded depth in soil based on the elastic wave technique[J]. Journal of Beijing University of Technology, 2012, 38(6): 870-874(Ch). [Google Scholar]
- Hu S B, Luo M Z, Cheng F, et al. Method of detecting the buried depth of guardrail metal column based on stress wave spectrum image[J]. Highway, 2022, 67(6): 336-341(Ch). [Google Scholar]
- Broggi A, Cerri P, Oleari F, et al. Guard rail detection using radar and vision data fusion for vehicle detection algorithm improvement and speed-up[C]//Proceedings of 2005 IEEE Intelligent Transportation Systems, 2005. New York: IEEE, 2005: 552-556. [Google Scholar]
- Alessandretti G, Broggi A, Cerri P. Vehicle and guard rail detection using radar and vision data fusion[J]. IEEE Transactions on Intelligent Transportation Systems, 2007, 8(1): 95-105. [Google Scholar]
- Seibert A, Hähnel M, Tewes A, et al. Camera-based detection and classification of soft shoulders, curbs and guardrails[C]//2013 IEEE Intelligent Vehicles Symposium (IV). New York: IEEE, 2013: 853-858. [Google Scholar]
- Wang Y, Yu Z J, Zhu L Q, et al. Automatic detection system of fence completeness for high-speed railway line[J]. Journal of the China Railway Society, 2013, 35(4): 43-50(Ch). [Google Scholar]
- Li Z Y, Li L, Zhu X F, et al. Deformation guardrail detection and mileage location based on binocular vision[J]. Technology & Economy in Areas of Communications, 2022, 24(2): 24-33(Ch). [Google Scholar]
- Ni C. Research and Application of Deformation Detection for W-Beam Guardrails on Highways under Complex Backgrounds[D]. Fujian: Fujian Agriculture and Forestry University, 2023(Ch). [Google Scholar]
- Tian X B, Yang H, Dai E H. Calibration of line-structured light in 3D reconstruction[J]. Applied Laser, 2023, 43(9): 138-146(Ch). [Google Scholar]
- Gao Q, Lu K F, Ji Y H, et al. Survey on the research of multi-sensor fusion SLAM[J]. Modern Radar, 2024, 46(8): 29-39(Ch). [Google Scholar]
- Cai Y, Liu C J. Parameters optimization of laser range sensor based on triangulation[J]. Chinese Journal of Sensors and Actuators, 2017, 30(10): 1472-1477(Ch). [Google Scholar]
- Guo H, Zhao W, Wang S, et al. Subspot background noise removal method based on bezier surface fitting[J]. Acta Photonica Sinica, 2024, 53(8): 0801003(Ch). [Google Scholar]
- Ruan J C, Xie M Y, Gao J S, et al. EGE-UNet: An efficient group enhanced UNet for skin lesion segmentation[C]//Medical Image Computing and Computer Assisted Intervention — MICCAI 2023. Cham: Springer-Verlag, 2023: 481-490. [Google Scholar]
- Zeng K, Liu H F, He X, et al. Line structured light center extraction based on improved steger algorithm[J]. Journal of North China University of Science and Technology (Natural Science Edition), 2021, 43(1): 101-107(Ch). [Google Scholar]
All Tables
All Figures
|
Fig. 1 Corrugated beam guardrail standard structure and guardrail specifications |
| In the text | |
|
Fig. 2 Specifications of corrugated guardrail plate |
| In the text | |
|
Fig. 3 Architecture diagram of the highway guardrail parameter detection operation robot |
| In the text | |
|
Fig. 4 Principle of structured light visual inspection |
| In the text | |
|
Fig. 5 Optical path diagram of direct-beam structure |
| In the text | |
|
Fig. 6 Structure diagram of sensor fixture |
| In the text | |
|
Fig.7 Camera projection model |
| In the text | |
|
Fig. 8 Detection model of structured light vision sensor |
| In the text | |
|
Fig.9 Coordinate system model of structured light scanning robot |
| In the text | |
|
Fig.10 Schematic diagram of robot attitude deviation |
| In the text | |
|
Fig.11 Coordinate system definition diagram |
| In the text | |
|
Fig. 12 System prototype |
| In the text | |
|
Fig. 13 Comparison test results of the beam center height |
| In the text | |
Current usage metrics show cumulative count of Article Views (full-text article views including HTML views, PDF and ePub downloads, according to the available data) and Abstracts Views on Vision4Press platform.
Data correspond to usage on the plateform after 2015. The current usage metrics is available 48-96 hours after online publication and is updated daily on week days.
Initial download of the metrics may take a while.