Fig. 11
Analysis of hub genes and drugs
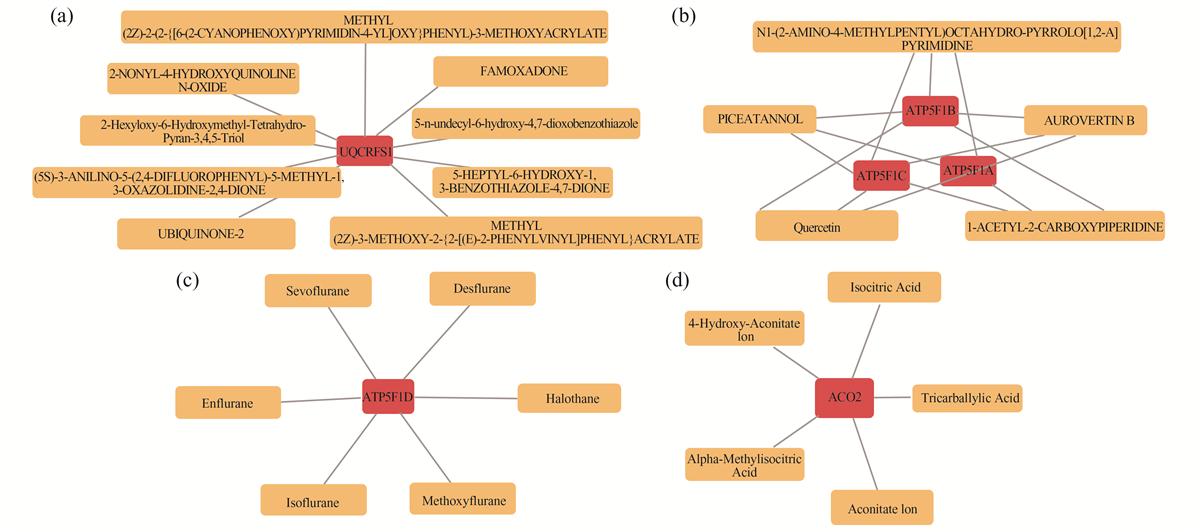
Download original image
The red dots represent genes, and the orange dots represent drugs. (a) Network of the association between UQCRFS1 and drugs. (b) Network of the association between ATP5B, ATP5A1, and ATP5C1 with drugs. (c) Network of the association between ATP5D and drugs. (d) Network of the association between ACO2 and drugs.
Current usage metrics show cumulative count of Article Views (full-text article views including HTML views, PDF and ePub downloads, according to the available data) and Abstracts Views on Vision4Press platform.
Data correspond to usage on the plateform after 2015. The current usage metrics is available 48-96 hours after online publication and is updated daily on week days.
Initial download of the metrics may take a while.