| Issue |
Wuhan Univ. J. Nat. Sci.
Volume 31, Number 2, April 2026
|
|
|---|---|---|
| Page(s) | 185 - 204 | |
| DOI | https://doi.org/10.1051/wujns/2026312185 | |
| Published online | 13 May 2026 | |
Biomedicine
CLC number: R734
ATP-Related Proteins Were Associated with Hürthle Cell Carcinomas Identified by Bioinformatic Analysis and Immunohistochemistry
ATP相关蛋白与Hürthle细胞癌的生物信息学和免疫组化研究
1
Department of Breast and Thyroid Surgery, Renmin Hospital of Wuhan University, Wuhan 430072, Hubei, China
(武汉大学人民医院 乳腺甲状腺外科,湖北 武汉 430072)
2
Information Center, Renmin Hospital of Wuhan University, Wuhan 430072, Hubei, China
(武汉大学人民医院 信息中心,湖北 武汉 430072)
3
Department of Thyroid Surgery, the First Affiliated Hospital, Zhejiang University School of Medicine, Hangzhou 310000, Zhejiang, China
(浙江大学医学院第一附属医院 甲状腺外科,浙江 杭州 310000)
† Corresponding author. E-mail: This email address is being protected from spambots. You need JavaScript enabled to view it.
; This email address is being protected from spambots. You need JavaScript enabled to view it.
Received:
16
September
2024
Abstract
The past few decades witnessed a significant increase in the incidence of thyroid cancer worldwide. Hürthle cell carcinoma (HCC), which was also known as oncocytic carcinoma of the thyroid, was reclassified as a distinct histological type of thyroid cancer by the WHO in 2022. Although HCC has a relative poorer prognosis and is generally insensitive to radioiodine treatment, the mechanisms behind HCC are poorly understood currently. In this paper, ioinformatics methods were employed to identify differentially expressed proteins (DEPs) and to analyze their functions in disease. R project was used to identify DEPs in HCC and Hürthle cell adenoma (HCA) with data from the iProx database. DEPs were annotated using the DAVID tool. Protein-protein interaction networks were constructed and visualized using the STRING database and the Cytoscape software. NetworkAnalyst was used to explore the relationships of DEPs, transcription factors, diseases, and drugs. The predicting ability of DEPs were evaluated with receiver operating characteristic (ROC) curves. Three DEPs with best performance were validated using immunohistochemistry. Experimental results show that a total of 793 and 295 DEPs were identified in HCC-normal and HCA-normal comparisons, respectively. The common DEPs of the two comparisons included ATP5F1A, ATP5F1B, UQCRFS1, ATP5F1D, ATP5F1C, COX5A, ATP5PD, ATP5PO, SUCLG1, and ACO2. The ROC analysis showed that ATP5F1B, ATP5F1C, and ATP5PD demonstrated the highest diagnostic accuracy, as indicated by their area under the curve (AUC) values, highlighting their superior performance. Immunohistochemistry confirmed the upregulation of the three proteins in HCC. Differential expression analysis revealed DEPs as potential biomarkers for HCC and HCA. Notably, the most dysregulated proteins are generally involved in the assembly of complex V, indicating a potential association between oxidative phosphorylation and the carcinogenesis of HCC.
摘要
近几十年来,全球甲状腺癌发病率呈显著上升趋势。Hürthle 细胞癌(Hürthle cell carcinoma)又称甲状腺嗜酸细胞癌,2022 年 WHO 已将其划分为独立的甲状腺癌组织学亚型。该肿瘤预后相对较差,且对放射性碘治疗普遍不敏感,其发病机制目前仍不明确。本研究基于蛋白质组学公共数据库 iProx,利用 R 软件筛选 Hürthle 细胞癌(HCC)与 Hürthle 细胞腺瘤(HCA)相对于正常组织的差异表达蛋白(DEPs),并通过 DAVID 进行功能富集注释;利用 STRING 及 Cytoscape 构建并可视化蛋白质相互作用网络;通过 NetworkAnalyst 分析差异蛋白与转录因子、疾病及药物的相互关系;采用 ROC 曲线评估核心基因的诊断效能,并通过免疫组化对关键分子进行验证。结果显示,HCC 组与正常组比较获得 793 个差异蛋白,HCA 组与正常组比较获得 295 个差异蛋白;取交集得到共同差异蛋白,并进一步筛选出 10 个核心基因,包括 ATP5F1A、 ATP5F1B、 UQCRFS1、 ATP5F1D、 ATP5F1C、 COX5A、 ATP5PD、 ATP5PO、 SUCLG1、 ACO2。ROC 曲线表明 ATP5F1B、 ATP5F1C、 ATP5PD 具有极高的诊断价值;免疫组化结果证实三者在 Hürthle 细胞癌中表达显著上调。综上,本研究发现多数异常表达蛋白参与线粒体复合物 V 组装,提示氧化磷酸化异常可能与 Hürthle 细胞癌的发生发展密切相关。
Key words: Hürthle cell carcinoma / oncocytic carcinoma / ATP / proteomics / thyroid malignancy
关键字 : Hürthle细胞癌 / 嗜酸细胞癌 / ATP / 蛋白质组学 / 甲状腺恶性肿瘤
Cite this article:WANG Jiaxi, LI Yinxin, YAN Mingzhu, et al. ATP-Related Proteins Were Associated with Hürthle Cell Carcinomas Identified by Bioinformatic Analysis and Immunohistochemistry[J]. Wuhan Univ J of Nat Sci, 2026, 31(2): 185-204.
These authors contributed equally to this work
Biography: WANG Jiaxi, male, Master candidate, research direction: the comprehensive study of thyroid cancer and breast cancer. E-mail: This email address is being protected from spambots. You need JavaScript enabled to view it.
Foundation item: Supported by the Natural Science Foundation of Hubei Province (2023AFB701) and the 2022 Cross-Innovation Talent Project of Renmin Hospital of Wuhan University (JCRCFZ-2022-015)
© Wuhan University 2026
 This is an Open Access article distributed under the terms of the Creative Commons Attribution License (https://creativecommons.org/licenses/by/4.0), which permits unrestricted use, distribution, and reproduction in any medium, provided the original work is properly cited.
0 Introduction
Over the past few decades, there has been a significant increase in the global incidence of thyroid cancer, with follicular thyroid carcinoma (FTC) being the second most common histological subtype among differentiated thyroid cancers[1]. In the 2017 WHO Classification of Tumours of Endocrine Organs, Hürthle cell carcinoma (HCC) was categorized as a distinct subtype of FTC and was thus renamed as oncocytic (Hürthle cell) carcinoma in the WHO classification[2]. Interestingly, in the new thyroid cancer pathology classification released by WHO in 2022, oncocytic (Hürthle cell) carcinoma has been excluded from FTC and reclassified as a distinct pathological entity. The guideline notes that HCC accounts for nearly 5% of differentiate thyroid cancers in the United States. Although women are more prone to developing HCC (female-to-male ratio of 1.6:1), the female-to-male ratio is lower compared to FTC[3]. The American Thyroid Association (ATA) guideline note that HCC is associated with a higher risk of lymph node metastasis, recurrence, and cancer-related death. Additionally, HCC has a lower affinity for radioactive iodine (I-131) treatment[4].
Hürthle cell adenoma (HCA) refers to a thyroid follicular adenoma where the principal component of the tumor (>75%) consists of follicular cells with oncocytic characteristics[2]. HCA was previously considered a distinct subtype of follicular adenoma, and was regarded as the benign counterpart of HCC[5]. It has been reclassified as "oncocytic adenoma of the thyroid" in the newest guideline[3].
Some common genetic mutations associated with thyroid cancer have been confirmed to exist in HCC. These mutated genes include RAS, TSHR, EIF1AX, TP53, PTEN, BRAF, and etc[6-16]. However, these mutations are only found in a small subset of HCC cases. These differences suggest that the spectrum of gene alterations in HCC may be different from that of other histological types and novel oncogenic pathways might be involved. These studies supported that HCC is a novel type of thyroid cancer with distinct molecular characteristics[17]. Alterations in the mitochondrial genome (mtDNA) and related nuclear genes are a prominent feature of HCC, particularly those involved in the assembly of complex Ⅰ and complex Ⅲ[7,9,18-21]. Copy number variations were discovered in more than one-third of tumors[6]. These alterations in mtDNA could lead to the disruption of complex I[17], and hence the impairment of mitochondrial function. Compensatory mitochondrial proliferation was noticed in most cases[22]. Furthermore, some other studies suggested that PIK3CA-Akt-mTOR and Wnt/β-catenin pathways could be involved in the oncogenesis of HCC. In addition, the overexpression of BRAF, extensive allelic loss and lipid peroxidation-induced oxidative stress were also closely related to the progression of HCC.
HCC has a high tendency for invasion and metastasis and thus poor prognosis. Compared with Papillary Thyroid Carcinoma (PTC), HCC is more likely to present with distant metastases via hematogenous route[23-27]. The rate of local invasion was higher in HCC in comparison with FTC and other types of thyroid cancers[23,27]. Hundahl and colleagues found that HCC had a poorer 10-year overall survival rate (76% vs. 85%) compared with FTC[28]. In addition, HCC also exhibited a poor response to radioactive iodine treatment[4,29]. Although the proportion of HCC ranged from 3%-7% in all differentiated thyroid cancers, it accounted for 10.5%-43.0% recurrence. A precise early-stage identification of HCC is supposed to significantly improve the prognosis of these patients[30-33].
Proteins, which are considered the ultimate products for most genes, play a crucial role in biological functions. Proteomics is a high throughout approach for analyzing protein abundance and provides inspiring insights into the diagnosis of diseases[34]. Proteins are far more stable in formalin-fixed paraffin-embedded tissues samples compared with nucleic acid. Research has shown that significant protein degradation was observed in 5.9% of samples, which was much lower than mRNA (21%)[35]. This lower degradation rate makes proteomics more reliable for certain types of analysis, especially long-term retrospective studies. Proteins are superior to mRNAs in representing biological functions since non-coding RNAs have an impact on mRNA translation, whereas proteins function as enzymes or receptors directly[36]. Furthermore, proteomics has been utilized to create diagnostic tools for predicting the benign or malignant status of thyroid nodules[37].
Up to now, the comprehensive mechanism of HCC is not fully understood. Previously discovered gene mutations and chromosomal alterations could not fully explain the pro-growth pathways activated in HCC. A reliable molecular signature is still lacking. New tumor markers are needed to improve the diagnosis and treatment of HCC in clinical practice.
To elucidate the complex mechanisms underlying HCC, we compared proteomic data obtained from HCC, HCA, and normal thyroid tissues. Core proteins related to HCC were identified using bioinformatics methods. The proteins with the highest diagnostic efficacy were validated by immunohistochemistry (IHC) in external samples to demonstrate that the proteins are associated with HCC development. These proteins could serve as novel biomarkers for HCC diagnosis and drug targets.
1 Materials and Methods
1.1 Data Acquisition
The procedure of this study is shown in Fig. 1. The protein expression profile data for this study was obtained from the iProX database (Supplementary Table 1). iProX is a public platform for collecting and sharing proteomics datasets[38]. The protein dataset (IPX0001444000) was released by Guo's lab at Westlake University. Tissue samples were processed with pressure cycling technology to isolate small molecular components. Subsequently, high-throughput sample evaluation was performed with mass spectrometry using data-independent acquisition. The IPX0001444000 dataset comprises 1 161 samples from various thyroid diseases, including differentiated thyroid cancer, benign thyroid diseases, and normal thyroid tissue (NOR). In the retrospective test and discovery subgroups, a total of 34 HCC, 72 HCA, and 157 NOR samples were pooled for further analysis.
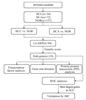 |
Fig. 1 Flow chart of data screening and analysis |
1.2 Identification of Differential Expression Proteins (DEPs)
The expression profiles were input into the R project (v4.2.2). Clinical information was collected for sample classification. Samples unrelated to the diseases of interest were excluded. The k-nearest neighbors algorithm in the DMwR2 package was used to impute missing data. Robust multi-array normalization was not performed since technical replicates were set for each sample and batch effects were minimized at the batch design level (Supplementary Fig. 1(a),(b)). UniProtKB AC/IDs were converted to official gene symbols using the online tool UniProt[39]. When multiple protein IDs correspond to one gene symbol, the median value was calculated. Differential expression proteins (DEPs) were identified in two comparisons (HCC vs. NOR and HCA vs. NOR) using Bayesian methods from the limma R package, and the overlapping DEPs were defined as common DEPs (Co-DEPs). To control for false positives, P-values were adjusted for multiple tests using the Benjamini-Hochberg method. DEPs were filtered based on the thresholds |log2FoldChange| 2 and adjusted P-value
 0.01. Principal component analysis (PCA) was performed on the three sample groups using SangerBox (v3.0). Subsequently, volcano plots and heat maps of DEPs were constructed for the two comparisons (HCC vs. NOR, HCA vs. NOR) to identify DEPs[40].
1.3 Gene Ontology and Pathway Enrichment Analysis
Gene ontology (GO) annotation and pathway enrichment analysis were conducted using the online tool DAVID (v2023q1)[41]. GO enrichment analysis comprises three categories: biological processes (BP), cellular components (CC), and molecular functions (MF). The Kyoto Encyclopedia of Genes and Genomes (KEGG) was utilized to analyze the primary pathways shared by DEPs. A threshold of P-value 0.05 was set for both GO enrichment analysis and pathway analysis. The results were visualized using bubble charts.
1.4 Construction of PPI Network and Identification of Hub Genes
The protein-protein interaction (PPI) of DEPs was analyzed using the online tool STRING (v11.5)[42]. PPIs with an interaction score of 0.9 are considered significant. The results from the STRING database were subsequently imported into Cytoscape (v3.9.1)[43] for the visualization of the PPI. The intersection of DEPs between HCC vs. NOR and HCA vs. NOR was evaluated using Venn diagrams[40]. A plugin software called CytoHubba was used to identify ten hub genes through the maximum cross correlation (MCC) algorithm (Supplementary Table 2). The diagnostic accuracy of the hub genes for HCC and HCA was assessed using receiver operating characteristic (ROC) curves and the area under the curve (AUC).
1.5 Transcription Factor Analysis
NetworkAnalyst is an online visualization and analysis platform for transcription factor (TF) analysis. TF-gene interaction information from the ENCODE database was retrieved using NetworkAnalyst (3.0)[44-45]. The information was then imported into Cytoscape (v3.9.1) for visualization[43]. The TF-miRNA co-regulatory interaction information was obtained from the RegNetwork database. Subsequently, a TF-miRNA coregulatory network was constructed using Cytoscape (v3.9.1)[46].
1.6 Associations Between Hub Genes and Diseases
The disease-related data associated with hub genes was obtained from the DisGeNET database using the NetworkAnalyst (3.0). Subsequently, a network related to gene-disease associations was constructed and visualized using Cytoscape (v3.9.1)[43-44,47].
1.7 Associations Between Hub Protein and Drugs
Data regarding the interaction between the protein products of hub genes and drugs from the DrugBank database was obtained using the NetworkAnalyst (3.0). Subsequently, the data was visualized using Cytoscape (v3.9.1)[43-44,48].
1.8 Immunohistochemistry Validation
For the external validation of ATP5PD, ATP5F1B, and ATP5F1C, tumor and adjacent tissues from four HCC patients and four HCA patients, all from Renmin Hospital of Wuhan University, were used (Supplementary Table 3). The inclusion criteria for patients were as follows: 1) age at the time of surgery 18 years, 2) the patient's pathological diagnosis was either HCC or HCA, confirmed postoperatively by at least three pathologists. Exclusion criteria were patients with autoimmune diseases, hematological disorders, infectious diseases, diabetes, a history of thyroid surgery or other malignant tumor surgeries, and those who had undergone chemotherapy or radiotherapy. Eight patients were categorized into HCC and HCA groups based on their histopathological outcomes. Normal controls were obtained from adjacent non-tumor tissues. Antibodies against ATP5PD, ATP5F1B, and ATP5F1C (Supplementary Table 4) were used to assess the expression levels of these proteins in HCC, HCA, and NOR. The Institutional Ethical Committee of Renmin Hospital of Wuhan University reviewed and approved the study design (No. WDRY2024-K038) and the requirement for obtaining informed consent from the involved patients was waived due to the retrospective nature of the study design. The results of the IHC were analyzed using the ImageJ software (v1.8.0).
2 Results
2.1 Identification of DEPs in Datasets
In the IPX0001444000 dataset, we selected three groups, namely, HCC, HCA, and NOR. A total of 6 749 genes were identified. By comparing HCC and HCA with NOR, 793 DEPs were identified in HCC and 295 DEPs were identified in HCA, respectively (Fig. 2 and 3). The dimensions of expression profiles among different groups were reduced in the PCA plot. The expression profiles of HCC and HCA partially overlaped, while NOR samples clustered separately (Supplementary Fig. 2).
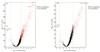 |
Fig. 2 Comparative analysis of proteomic expression profiles between different groups (a) Volcano plot showing upregulation (red dots) and downregulation (green dots) between HCC and NOR. (b) Volcano plot showing upregulation (red dots) and downregulation (green dots) between HCA and NOR. |
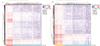 |
Fig. 3 Cluster heatmaps of proteomic expression profiles for different groups (a) The red square represents the HCC group, and the blue square represents the NOR group. (b) The yellow square represents the HCA group, and the blue square represents the NOR group. |
2.2 Functional Analysis of HCC and NOR-DEPs
By comparing HCC with NOR, we identified 793 DEPs (FC>4, adjusted P-value<0.01). Among these DEPs, there were 781 upregulated genes and 12 downregulated genes (Fig. 2(a)). In HCC, ETFB, ECI1, and NNT were the three most significantly up-regulated genes, while ISLR, APCS, and VPS13D were the three most significantly down-regulated ones. All of these genes showed statistical significance. In terms of overall protein expression, there were also significant expression differences between HCC and NOR (Fig. 3(a)).
Functional annotation of the identified DEPs was performed using the DAVID database, focusing on BP, CC, and MF. For HCC vs. NOR-DEPs, the most enriched BP was translation, with fold enrichment (FE) of 9.80. Other enriched BPs included cytoplasmic translation (FE=20.16), negative regulation of apoptotic process (FE=1.73), protein stabilization (FE=3.84), and intracellular protein transport (FE=2.57). These DEPs also showed significant enrichment in CCs such as the cytosol (FE=2.24) and cytoplasm (FE=1.79). In addition, enriched MFs included protein binding (FE=1.27), RNA binding (FE=4.24), identical protein binding (FE=1.96), ATP binding (FE=1.97), and structural constituent of ribosome (FE=9.94). All of the above GOs were significantly different.
The pathway enrichment analysis based on KEGG database indicated that the relevant pathways for HCC vs. NOR-DEPs were primarily associated with metabolic pathways (FE=1.995), ribosome (FE=6.83), coronavirus disease-COVID-19 (FE=4.70), pathways of neurodegeneration-multiple diseases (FE=2.20), and Parkinson's disease (FE=3.65). All of these pathways were significantly different (Fig. 4(a)-(d)).
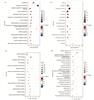 |
Fig. 4 Enrichment analysis of differentially expressed genes between HCC and NOR using GO and KEGG (a) Bubble chart of biological process (BP). (b) Bubble chart of cellular component (CC). (c) Bubble chart of molecular function (MF). (d) Bubble chart of KEGG pathway. |
2.3 Functional Analysis of HCA and NOR-DEPs
In the comparison of HCA with normal thyroid tissue, 295 DEPs (FC>4, adjusted P-value<0.01) were identified. Among these DEPs, there were 293 upregulated genes and 2 downregulated genes (Fig. 2(b)). Of the differential genes in HCA vs. NOR, GOT2, and UQCRFS1 were the three most significantly upregulated genes, while ISLR and APCS were significantly downregulated. On total protein expression, HCA and NOR showed significant differences (Fig. 3(b)).
For HCA vs. NOR-DEPs, the most enriched BPs included translation (FE=10.76), cytoplasmic translation (FE=22.22), hydrogen ion transmembrane transport (FE=11.59), tricarboxylic acid cycle (FE=40.40), and negative regulation of apoptotic process (FE=2.14). In terms of CC, these DEPs were primarily enriched in the mitochondrion (FE=8.18), cytosol (FE=1.81), extracellular exosome (FE=4.05), cytoplasm (FE=1.39, P-value<0.05), and nucleus (FE=1.15). Enriched MFs primarily focused on protein binding (FE=1.14), RNA binding (FE=3.38), identical protein binding (FE=2.10), and ATP binding (FE=1.97). The most enriched KEGG pathways for these DEPs included metabolic pathways (FE=3.07) and Parkinson's disease (FE=6.03). The GOs and pathways mentioned above are significantly different (Fig. 5(a)-(d)).
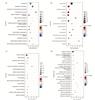 |
Fig. 5 Enrichment analysis of differentially expressed genes between HCA and NOR using GO and KEGG (a) Bubble chart of biological process (BP). (b) Bubble chart of cellular component (CC). (c) Bubble chart of molecular function (MF). (d) Bubble chart of KEGG pathway. |
2.4 PPI Networks of HCC vs. NOR-DEPs and HCA vs. NOR-DEPs
HCC vs. NOR-DEPs and HCA vs. NOR-DEPs were separately imported into the online STRING database. Genes with no interactions were removed, and the interacting genes were examined. The PPI network for HCC vs. NOR-DEPs comprised 52 nodes, while the PPI network for HCA vs. NOR-DEPs consisted of 59 nodes (Fig. 6(a), (b)).
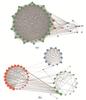 |
Fig. 6 Protein-protein interaction (PPI) network analysis of DEPs The color of the dots represents the clustering of proteins. The thickness of the connecting line represents the degree of tightness between proteins. (a) The PPI network for HCC vs. NOR-DEPs. (b) The PPI network for HCA vs. NOR-DEPs. |
Gene scoring identified significant nodes related to HCC vs. NOR-DEPs, including GAPDH (degree=293), HSPA8 (degree=232), EEF2 (degree=231), HSP90AA1 (degree=231), RPS3 (degree=216), and etc.
In the HCA vs. NOR-DEPs' PPI network, ATP5F1A (degree=123), GAPDH (degree=117), ACO2 (degree=116), SDHA (degree=109), and ATP synthase F1 subunit beta (ATP5F1B, degree=106) were identified.
A Venn diagram (Fig. 7(a)) revealed 94 genes both differentially expressed in two comparisons. To further identify key genes associated with HCC development, these 94 genes were imported into STRING to obtain interaction data (Fig. 7(b)). Using the MCC algorithm, the top ten ranked genes (hug gene) were identified, including ATP5F1B (score=8 672), ATP synthase F1 subunit gamma (ATP5F1C, score=7 346), ATP synthase peripheral stalk subunit D (ATP5PD, score=6 240) (Fig. 7(c)).
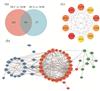 |
Fig. 7 Screen out hub genes based on the intersection of two comparisons (HCC vs. NOR and HCA vs. NOR) (a) The Venn diagram shows the intersection of differentially expressed genes of two comparisons. (b) PPI network analysis of 94 intersecting genes. (c) PPI network analysis of the top ten genes among 94 intersecting genes. |
2.5 Validation of Hub Genes
ROC curve was conducted to explore the sensitivity and specificity of hub genes for diagnosing HCC. Validation using an internal dataset revealed the following AUC values. Hub genes with the best predicting ability was ATP5PD (AUC=0.997), followed by ATP5F1B (AUC=0.996) and ATP5F1C (AUC=0.996). Notably, the AUCs of all these 10 selected genes were higher than 0.980 (Fig. 8).
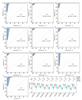 |
Fig. 8 Receiver operating characteristic (ROC) of hub genes (a) ATP5F1A. (b) ATP5F1B. (c) UQCRFS1. (d) ATP5F1D. (e) ATP5F1C. (f) COX5A. (g) ATP5PD. (h) ATP5PO. (i) SUCLG1. (j) ACO2. (k) The protein expression levels of hub genes in different groups (∗ P<0.05, ∗∗ P<0.01, ∗∗∗ P<0.001, and ∗∗∗∗ P<0.000 1). |
2.6 Transcription Factor Analysis of Hub Genes
The associations of 10 hub genes and 206 related TFs were constructed. Further analysis revealed 39 TFs and 43 miRNAs interacted with the 10 selected genes (Fig. 9).
 |
Fig. 9 Transcription factor analysis of hub genes The network of ten hub genes and 39 TFs and 43 miRNAs. The red dots represent genes, the blue dots represent miRNAs, and the yellow dots represent TFs. |
2.7 Correlation between Hub Genes and Diseases
Querying DisGeNET for these ten genes predicted that ACO2 and ATP5F1B were associated with several diseases, while the other genes showed no correlation with any disease. In the predictions, ACO2 was related to 37 diseases, such as liver carcinoma, epilepsy, and cerebellar degeneration, suggesting that ACO2 may play a significant role in the development of various diseases. ATP5F1B was predicted to be associated with 5 diseases, including precancerous conditions, hypoxia, non-alcoholic fatty liver disease, spinocerebellar ataxia 17 and acute kidney injury (Fig. 10). The disorders associated with ACO2 and ATP5F1B did not intersect.
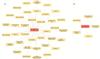 |
Fig. 10 Analysis of hub genes and diseases The red dots represent genes, and the yellow dots represent diseases. (a) Network of the association between ACO2 and diseases. (b) Network of the association between ATP5B and diseases. |
2.8 Correlation between Hub Genes and Drugs
Five drugs, quercetin, 1-acetyl-2-carboxypiperidine, aurovertin b, piceatannol, and N1-(2-amino-4-methylpentyl) octahydro-pyrrolo[1,2-a] pyrimidine, have been shown to interact with the protein products of three genes: ATP5F1A, ATP5F1B, and ATP5F1C. The analysis of protein-drug interactions indicates that the protein product of UQCRFS1 can interact with 8 drugs. Additionally, the protein product of ATP5F1D can interact with 6 drugs, while the protein product of ACO2 can interact with 5 drugs. Furthermore, the protein product of COX5A can interact with 2 drugs, which are cholic acid and N-formylmethionine(Fig. 11(a)-(d)).
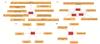 |
Fig. 11 Analysis of hub genes and drugs The red dots represent genes, and the orange dots represent drugs. (a) Network of the association between UQCRFS1 and drugs. (b) Network of the association between ATP5B, ATP5A1, and ATP5C1 with drugs. (c) Network of the association between ATP5D and drugs. (d) Network of the association between ACO2 and drugs. |
2.9 Validation by IHC
IHC was used to validate the expression differences of the top three proteins with the highest AUCs (ATP5PD, ATP5F1B, ATP5F1C) in an independent cohort of 8 patients (4 HCC and 4 HCA) (Fig. 12). The IHC results confirmed that ATP5PD, ATP5F1B, and ATP5F1C were significantly upregulated in HCC tissues compared to HCA tissues and adjacent normal thyroid tissues (Fig. 12(a)-(l)).
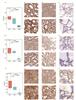 |
Fig. 12 Validation of differential expression of ATP5F1B, ATP5F1C, and ATP5PD between HCC, HCA, and NOR in another independent queue (a-c) HCC tissue shows significant upregulation of ATP5F1B, ATP5F1C and ATP5PD compared to HCA tissue. Similarly, compared to NOR tissue, these three genes are significantly upregulated in HCC and HCA. Evaluation of IHC staining is based on the sum of percentage and intensity scores. (d-l) Representative IHC staining of ATP5F1B (d, HCC; e, HCA; f, NOR) and ATP5F1C (g, HCC; h, HCA; i, NOR) and ATP5PD (j, HCC; k, HCA; l, NOR). |
3 Discussion
HCC, a rare type of thyroid cancer, is closely associated with mitochondrial dysfunction. Compared to common thyroid papillary carcinoma, HCC presents with greater treatment challenges and poorer prognosis. This has sparked in-depth research into the biological mechanisms of HCC in hopes of discovering potential diagnostic markers and treatment targets. WHO guideline suggests a potential link between HCC and HCA[3]. Mutations in mtDNA have been shown to be closely associated with the occurrence of HCC.
In our study, we employed bioinformatics methods to organize and analyze the proteomics data available on iProX. We explored the molecular mechanisms of HCC oncogenesis. Our focus was on proteins related to mitochondrial function. Ultimately, we found that HCC and HCA share some genes closely related to metabolism. These genes are involved in the composition of ATP synthase (mitochondrial complex V), the function of mitochondrial complexes Ⅲ and Ⅳ, and critical mitochondrial metabolic pathways like the citric acid cycle (TCA). We further validated the expression of the top three proteins with the highest AUCs in ROC curves through immunohistochemistry. We found that these proteins were significantly more highly expressed in HCC than in HCA and significantly higher in HCA than in NOR, which is consistent with our analysis results.
Consistent with the pathological characteristics, the DEPs exhibited significant differences between HCC and NOR, as well as HCA and NOR. Subsequently, we conducted GO and KEGG analyses of these DEPs. Interestingly, both HCC vs. NOR and HCA vs. NOR showed enrichment in cytoplasmic translation, hydrogen ion transmembrane transport, and negative regulation of apoptotic processes. There were 28 upregulated genes related to cytoplasmic translation shared between the two comparisons. These genes primarily participate in the construction of ribosomal large subunits and catalyze protein synthesis. This suggests that the ribosomes in both HCC and HCA may exhibit abnormal activity, potentially contributing to the maintenance of rapid cancer cell proliferation. Ribosomes are essential cellular organelles involved in translation, catalysis, and protein structure maintenance. In cancer cells, protein synthesis is often increased to support abnormal cell division and growth. Overactive ribosomes can promote the development of malignant tumors. Upregulation of the nuclear gene HEATR1 may promote ribosomal function by affecting the transcription and processing of ribosomal RNA polymerase I. This has been associated with poor survival rates and malignant clinical features in liver cell carcinoma[49]. In certain tissues, the sustained activation of the ribosomal stress response may lead to the loss of P53 function, increasing the risk of cancer development. Meanwhile, the upregulation of ribosome biogenesis rates is associated with tissue tumor transformation influenced by chronic inflammation. Ribosomal dysfunction may be a contributing factor to the increased susceptibility to cancer in ribosomopathies as well[50]. Furthermore, a range of rare genetic diseases that lead to alterations in ribosome production, known as ribosomopathies, have a significantly higher risk of cancer incidence compared to chronic infections, although they are much less common[51]. Based on our research results, it can be inferred that the upregulation of mitochondrial function may be associated with the occurrence of HCC.
The intersection of DEPs between HCC vs. NOR and HCA vs. NOR reveals 23 proteins. These proteins are associated with hydrogen ion transmembrane transport, and are mainly involved in complex assembly, intracellular acid vesicle formation and acidification, and the transport of ADP and ATP within mitochondria[52]. In both HCC and HCA, these proteins are upregulated compared to normal thyroid tissue.
Furthermore, the PPI network primarily demonstrates the close interactions among these identified proteins, which are mainly involved in the formation of complexes in the oxidative respiratory chain and serve as enzyme proteins in the citric acid cycle.
Specifically, we observed significant upregulation in the expression of proteins such as ATP5F1A, ATP5F1B, ATP5F1C, ATP5F1D, ATP5PD, and ATP5PO, all of which are components of ATP synthase (complex V). Additionally, UQCRFS1 and COX5A are involved in the construction of complex Ⅲ and Ⅳ, while ACO2 and SUCLG1 are related to the citric acid cycle. Existing research suggests that mtDNA mutations and copy number alterations in HCC often occur in complex Ⅰ and Ⅲ, but there have been limited reports on genes related to complex V[7,9,18-21,53]. The differential expression of these proteins in various cancers suggests that they may play a critical role in the development and progression of tumors.
The phosphorylation of ATP5F1A has been shown to prevent its binding to the physiological inhibitor subunit (ATP synthase inhibitory factor subunit 1), leading to sustained mitochondrial activity, thus promoting cancer cell growth. Furthermore, through TNK2/ACK1 mediation, the phosphorylation of ATP5F1A not only enhances the stability of complex V but also increases mitochondrial energy output in cancer cells[54]. This is related to the synergistic interaction among AURKA/ATP5F1A/ATP5F1B, as they collectively maintain the energy metabolism and cell survival of breast cancer cells[55]. In addition, studies have reported that ATP5FA1 may play a critical role in cervical cancer cells by regulating the expression and alternative splicing of cancer-related genes[56]. Additionally, the progression of clear cell renal cell carcinoma is associated with the regulation of ATP5F1A phosphorylation, likely mediated through tumor-related signaling pathways[57].
ATP5F1A is also associated with autoimmune atrophic gastritis, a condition that may progress to gastric cancer. ATP5F1A is a shared gene between these two conditions, but its expression levels are relatively low[58]. Furthermore, other studies have revealed that the loss of ATP5F1A promotes cell proliferation and may be indicative of an unfavorable prognosis in colorectal adenocarcinoma[59]. Ling et al[60] has unveiled the potential therapeutic role of ATP5FA1 in alleviating LPS-induced depression-like behavior and cognitive impairments, which may have significant implications for the treatment of Alzheimer's disease. Interestingly, mutations in ATP5F1A in neonates may lead to developmental disorders, high lactic acidemia, hyperammonemia, and pronounced clinical symptoms in infants[61]. Additionally, research has shown that both ATP5F1A and ATP5F1B are associated with isolated muscle tension disorders[62]. These studies collectively demonstrate that ATP5F1A may have diverse functions in various tissues, and both its high and low expression levels may be associated with cancer cell proliferation.
The study of Slater et al[63] revealed that ATP5F1B is expressed in metastatic uveal melanoma, and this high expression is associated with poor prognosis. The interactions between AURKA, ATP5F1A, and ATP5F1B exhibit metabolic-specific trends in triple-negative breast cancer cell lines, and they are closely associated with cell fate. On one hand, this interaction induces G0/G1 arrest in cells primarily relying on oxidative phosphorylation as their main energy source. On the other hand, it can bypass the cell cycle arrest and trigger cell death in cells with glycolytic metabolism[55]. The steroid receptor RNA activator 1 (SRA1) gene plays a crucial role in the progression of various cancers. Its mechanism of action includes mediation through the long non-coding RNA SRA (LncRNA SRA). LncRNA SRA can also function as an oncogene by modulating the OXPHOS pathway in colorectal cancer. Knocking down LncRNA SRA results in changes in the expression levels of genes involved in the OXPHOS pathway and ATP5F1B[64]. These studies collectively demonstrate that high expression of ATP5F1B may increase tumor invasiveness. Conversely, inhibiting the expression levels of ATP5F1B through non-coding RNA or other pathways may help suppress tumor growth.
Another study suggests that in the breast cancer MDA-MD-231 cell line, cells with high ATP5F1C expression exhibit a fivefold lower in vivo metastatic capability than low-expression cells. Furthermore, knocking out ATP5F1C can reduce ATP generation and cell migration[65].
The research of Song et al[66] has revealed that drug resistance in tumor cells is initiated through the epigenetic loss of ATP synthase subunit ATP5PD, resulting in a core metabolic reprogramming pathway. This leads to the accumulation of ROS under normoxic conditions and stabilization of HIF-α, granting tumor cells a stem-like and invasive phenotype. The loss of ATP5PD is closely associated with treatment failure, disease progression, and poor survival rates in cancer patients. In addition, the ATP5PD/KCTD2 locus is also associated with the risk of Alzheimer's disease[67].
Furthermore, studies suggest that P53 damage may lead to an increase in ATP5PO expression[68], providing indirect evidence for the potential association between high ATP5PO expression and increased tumor invasiveness.
UQCRFS1 is a crucial component of mitochondrial complex Ⅲ, and its incorporation is the second-to-last step in the assembly of complex Ⅲ[69]. UQCRFS1 contains a catalytic core subunit with a 2Fe-2S cluster, and previous research has clearly indicated that UQCRFS1 is closely associated with cell growth[70]. In earlier studies, there were reports indicating significant differences in the activity of complex Ⅲ between normal and invasive metastatic breast cancer cell lines, particularly notable differences in the expression of UQCRFS1 (encoding the RISP protein). Knocking out UQCRFS1 resulted in a decrease in mitochondrial membrane potential, subsequently reducing the degree of matrix invasion[71]. Furthermore, a study in 2012 identified nine significantly amplified genes in patients with ER-negative grade Ⅲ breast cancer, among which UQCRFS1, POP4, and PLEKHF1 were included[72]. SIRT6 is an NAD+-dependent deacetylase that can enhance the expression and activity of pyruvate dehydrogenase in breast cancer cells through its enzymatic activity. It reduces the activity of AMPK. Silencing SIRT6 can potentially inhibit the expression of UQCRFS1, showing promise as a treatment approach for breast cancer[73]. This might suggest that the high expression of UQCRFS1 is associated with increased cancer invasiveness. Furthermore, subsequent research has further confirmed the close association of UQCRFS1 with various cancers, including acute lymphocytic leukemia, gastric cancer, renal clear cell carcinoma, and ovarian cancer[74-79]. Additionally, research has found that UQCRFS1 may be a potential biomarker for predicting the prognosis of cutaneous melanoma[80]. These findings emphasize the potential significance of UQCRFS1 in various cancer types, particularly its role in regulating cancer cell invasiveness. Further insights into the biological functions and regulatory mechanisms of UQCRFS1 will help uncover its roles in different cancers, providing valuable insights for future therapeutic strategies.
COX5A is a crucial gene encoding mitochondrial complex Ⅳ, also known as cytochrome c oxidase. This complex plays a critical role in transferring electrons from NADH and succinate to oxygen molecules while creating an electrochemical gradient across the inner mitochondrial membrane to drive transmembrane electron transfer and ATP synthesis. Studies have shown upregulated expression of COX5A, COX5B, and ATP5PD in renal oncocytoma[81]. Liu et al[82] revealed that by comparing the mitochondrial proteins of nasopharyngeal carcinoma cells with metastatic capability to those without, ten mitochondrial genes, including COX5A, were found to conform to the tumor-stroma co-evolution model. This suggests that these genes might be directly involved in tumor metastasis by regulating oxidative stress. In 2020, Zeng and colleagues[83] discovered a positive correlation between COX5A and the metastasis and drug resistance of ER+ breast cancer. Knocking down COX5A can increase breast cancer cell sensitivity to chemotherapy by reducing ATP levels and increasing the production of reactive oxygen species. MiR-204 can target and inhibit the expression of COX5A, thereby reversing the function of COX5A in ER+ breast cancer cells. Furthermore, under hypoxic conditions, miR-26a-5p and miR-26b-5p may directly regulate COX5A, thereby modulating oxygen-related cell death[84]. In contrast to other tumors, the expression level of COX5A in glioblastoma is relatively lower compared to low-grade gliomas and normal brain tissue. This may be associated with the increased glycolytic activity in glioblastoma[85-86]. Overall, our study reveals that the differentially expressed proteins shared between HCC and HCA may play crucial roles in the progression from normal thyroid tissue to oncocytic adenoma and oncocytic carcinoma. Particularly, proteins like COX5A exhibit significant impacts on oxidative stress, metastasis, and drug resistance in tumors.
Current research suggests that thyroid cancer can often survive within the context of tricarboxylic acid cycle impairments, including HCC. Additionally, in HCC, the levels of intermediates in the citric acid cycle significantly decrease compared to normal tissue, while the levels of enzyme proteins involved in the citric acid cycle markedly increase[87]. Without a doubt, the upregulation of ACO2 and SUCLG1 identified in this study is consistent with previous research findings in HCC.
In general, these previous studies support the reliability of our data and analysis results, suggesting that these differentially expressed proteins could serve as candidate biomarkers for predicting the transformation from normal thyroid tissue to HCC.
To confirm the accuracy of our data as a resource for further research, we applied MCC scores to the proteins in the PPI network, selected the top ten proteins with the highest scores as core proteins, conducted ROC analysis on these core proteins, and validated the top three proteins with the highest AUC using an external dataset through immunohistochemistry. The results revealed that ATP5PD, ATP5F1B, and ATP5F1C were significantly higher in HCC compared to HCA, and all of them were significantly elevated compared to normal thyroid tissue. This suggests that normal thyroid tissue may gradually transform into HCA and then further progress into HCC, with the function of complex V continuously strengthening throughout this process.
In summary, our study primarily discovered significant upregulation of proteins related to mitochondrial complex Ⅴ, Ⅲ, Ⅳ, and enzymes of the citric acid cycle in HCC compared to normal thyroid tissue. This may imply the presence of inhibition in the upstream aerobic oxidation metabolism. Previous research has indeed found that the ratio of acetate to lactate is significantly decreased in HCC. This suggests that HCC primarily relies on anaerobic glycolysis to produce lactate as the main source of energy production. The study also found that the accumulation of 2-phosphoglycerate (2PG) levels is 27 times higher than that of adjacent normal tissue, further confirming the notion of enhanced anaerobic glycolysis in HCC[87]. It is hypothesized that the increased production of lactate through anaerobic fermentation may be linked to the eosinophilic staining observed in HCC. This may be due to the absence or low expression of a molecule located upstream of the oxidative respiratory chain, resulting in reduced production of aerobic oxidation products of sugars. As a result, there is an increase in the adaptive level of enzyme proteins downstream of the citric acid cycle and in the complex. The latest research shows that lactic acid accumulation not only affects energy metabolism but also regulates gene expression through histone or nonhistone lactylation, which provides a new research direction for the further study of the pathogenesis of HCC.
The identification of four different proteins, ATP5F1E, ATP5PB, ATP5MG, and ATP5ME, which are subunits of ATP synthase, is significant. ATP5F1E encodes the ATP synthase F1 subunit epsilon and plays a role in catalyzing the formation of ATP from ADP, working together with subunits alpha, beta, gamma, and sigma in the F1 portion of ATP synthase. ATP5PD, ATP5ME, and ATP5MG, on the other hand, encode subunits b, e, and g, respectively, and together with six other subunits. They constitute the F0 portion, which forms the proton channel. These subunits are integral components of ATP synthase, a critical enzyme in cellular energy production[52]. The significant upregulation of these proteins in HCC indicates that the overall function of ATP synthase may be enhanced. This upregulation may be a secondary response to a shortage of substrates for the enzyme.
Among the drugs capable of interacting with the protein products of hub genes, Diazoxide is a non-diuretic benzothiadiazine used to treat hypoglycemia in patients with insulin overproduction caused by various conditions. Previous research has indicated its inhibitory effects on ATP synthase activity in myocardial cells, achieving cardioprotective mechanisms by reducing ATP production. In HCC, multiple proteins that makeup ATP synthase show a significant increase. This suggests that Diazoxide may have potential utility in the treatment of HCC[88]. Additionally, a proteomic study suggests that Artenimol may act as a ligand to bind with the α-subunit of ATP synthase, ATP synthase subunit O, and ATP synthase membrane subunit G. These three proteins showed significant upregulation in our study. This interaction potentially exerts an anti-inflammatory effect. However, it is not yet clear whether it promotes ATP production or inhibits ATP production[89]. These drugs that can affect ATP synthase have been shown to impact its function. This could hold potential for the treatment of HCC in the future.
Vacuolar-type ATPase (V-ATPase) is a multi-subunit enzyme consisting of a peripheral complex (V1) that hydrolyzes ATP and an integral membrane complex (V0) that transports protons across membranes. Its function is to acidify intracellular compartments in eukaryotic cells. V-ATPase is widely expressed and found in organelles such as vacuoles, lysosomes, and endosomes, which are membrane-bound cellular organelles[52]. The upregulation of the A subunit and the E1 subunit of V-ATPase in our study provides a reasonable explanation for the increased acidity observed in HCC. These subunits are part of the vacuolar ATPase complex, which plays a role in acidifying intracellular compartments. The upregulation of these subunits might contribute to the altered acid-base balance within HCC cells.
The current study has some intrinsic limitations. Proteomics sequencing data were employed to discern and scrutinize HCC and HCA. However, the scarcity of multiple HCC-related datasets in public databases posed a challenge in procuring sequencing data suitable for external validation, potentially influencing the outcomes. Furthermore, while this study suggested that the upregulation of proteins related to aerobic oxidation was an adaptive response to the absence or downregulation of upstream molecules, the identification of a specific initiator molecule remained elusive. This aspect warranted further investigation in future studies for confirmation and validation.
Limited by the incidence of HCC and the sample size of a single center, we are unable to obtain more samples for IHC verification. In the future, we will carry out multi-center research to strengthen the reliability of the research.
4 Conclusion
Our study revealed a close association between the proteins involved in the assembly of complex V and the occurrence of HCC. By comparing HCC with HCA and normal thyroid tissues, the expression of these DEPs in HCA fell between those of HCC and normal tissues with statistical significance. This phenomenon supported the hypothesis that normal thyroid tissues first progress to HCA and then develop into HCC. The hub genes we identified include ACO2 and SUCLG1, which are involved in the citric acid cycle, and we validated the top three proteins with the highest AUC using IHC. This corroborates previous research findings and further supports the reliability of our study. The differences in proteins related to complex V offer novel insights for research and treatment. The enhanced anaerobic glycolysis leading to increased lactate production in HCC may be one of the reasons for the acidic staining characteristics observed. There might be a molecular deficiency or downregulation in the upstream oxidative phosphorylation, leading to a decrease in the production of aerobic oxidation products from glucose. This, in turn, increases the adaptive levels of enzymes in the downstream citric acid cycle and complex V. By inhibiting the activity of these proteins, it is possible to suppress HCC activity. This study revealed hub genes that could serve as potential biomarkers and therapeutic targets for HCC in clinical practice.
The datasets presented in this study can be found in online repositories. The names of the repository/repositories and accession number(s) can be found in the article[37]/supplementary materials.
Data Availability Statement
The datasets presented in this study can be found in online repositories. The names of the repository/repositories and accession number(s) can be found in the article[37]/supplementary materials.
Ethics Statement
The study has been approved by the Ethics Committee of Renmin Hospital of Wuhan University (NO. WDRY2024-K038). The requirement for obtaining informed consent from the involved patients was waived due to the retrospective nature of the study design.
Acknowledgments
We gratefully acknowledge the helpful suggestion from our team members and the Guo's lab for providing datasets on iProX.
Competing Interests
The authors declare that the research was conducted in the absence of any commercial or financial relationships that could be construed as a potential conflict of interest.
Supplementary Materials
Supplementary file provided by the authors. Access Supplementary Material
References
- Grani G, Lamartina L, Durante C, et al. Follicular thyroid cancer and Hürthle cell carcinoma: Challenges in diagnosis, treatment, and clinical management[J]. The Lancet Diabetes & Endocrinology, 2018, 6(6): 500-514. [Google Scholar]
- Lloyd R V, Osamura R Y, Klöppel G, et al. World Health Organization Classification of Tumours of Endocrine Organs[M]. Lyon: IARC Press, 2017. [Google Scholar]
- Baloch Z W, Asa S L, Barletta J A, et al. Overview of the 2022 WHO classification of thyroid neoplasms[J]. Endocrine Pathology, 2022, 33(1): 27-63. [Google Scholar]
- Haugen B R, Alexander E K, Bible K C, et al. 2015 American thyroid association management guidelines for adult patients with thyroid nodules and differentiated thyroid cancer: The American thyroid association guidelines task force on thyroid nodules and differentiated thyroid cancer[J]. Thyroid, 2016, 26(1): 1-133. [Google Scholar]
- Jalaly J B, Baloch Z W. Hürthle-cell neoplasms of the thyroid: An algorithmic approach to pathologic diagnosis in light of molecular advances[J]. Seminars in Diagnostic Pathology, 2020, 37(5): 234-242. [Google Scholar]
- Doerfler W R, Nikitski A V, Morariu E M, et al. Molecular alterations in Hürthle cell nodules and preoperative cancer risk[J]. Endocrine-Related Cancer, 2021, 28(5): 301-309. [Google Scholar]
- Ganly I, Makarov V, Deraje S, et al. Integrated genomic analysis of Hürthle cell cancer reveals oncogenic drivers, recurrent mitochondrial mutations, and unique chromosomal landscapes[J]. Cancer Cell, 2018, 34(2): 256-270.e5. [Google Scholar]
- Ganly I, Filho J R, Eng S, et al. Genomic dissection of Hurthle cell carcinoma reveals a unique class of thyroid malignancy[J]. The Journal of Clinical Endocrinology and Metabolism, 2013, 98(5): E962-E972. [Google Scholar]
- Gopal R K, Kübler K, Calvo S E, et al. Widespread chromosomal losses and mitochondrial DNA alterations as genetic drivers in Hürthle cell carcinoma[J]. Cancer Cell, 2018, 34(2): 242-255.e5. [Google Scholar]
- Schatz-Siemers N, Brandler C T, Oweity T, et al. Hürthle cell lesions on thyroid fine needle aspiration cytology: Molecular and histologic correlation[J]. Diagnostic Cytopathology, 2019, 47(10): 977-985. [Google Scholar]
- Wong K S, Angell T E, Barletta J A, et al. Hürthle cell lesions of the thyroid: Progress made and challenges remaining[J]. Cancer Cytopathology, 2021, 129(5): 347-362. [Google Scholar]
- Evangelisti C, de Biase D, Kurelac I, et al. A mutation screening of oncogenes, tumor suppressor gene TP53 and nuclear encoded mitochondrial complex I genes in oncocytic thyroid tumors[J]. BMC Cancer, 2015, 15: 157. [Google Scholar]
- Kasaian K, Chindris A M, Wiseman S M, et al. MEN1 mutations in Hürthle cell (oncocytic) thyroid carcinoma[J]. J Clin Endocrinol Metab, 2015, 100(4): E611-E615. [Google Scholar]
- Landa I, Ibrahimpasic T, Boucai L, et al. Genomic and transcriptomic hallmarks of poorly differentiated and anaplastic thyroid cancers[J]. J Clin Invest, 2016, 126(3): 1052-1066. [Google Scholar]
- Nikiforova M N, Wald A I, Roy S, et al. Targeted next-generation sequencing panel (ThyroSeq) for detection of mutations in thyroid cancer[J]. J Clin Endocrinol Metab, 2013, 98(11): E1852-E1860. [Google Scholar]
- Wei S Z, LiVolsi V A, Montone K T, et al. PTEN and TP53 mutations in oncocytic follicular carcinoma[J]. Endocrine Pathology, 2015, 26(4): 365-369. [Google Scholar]
- McFadden D G, Sadow P M. Genetics, diagnosis, and management of Hürthle cell thyroid neoplasms[J]. Frontiers in Endocrinology, 2021, 12: 696386. [Google Scholar]
- Yeh J J, Lunetta K L, van Orsouw N J, et al. Somatic mitochondrial DNA (mtDNA) mutations in papillary thyroid carcinomas and differential mtDNA sequence variants in cases with thyroid tumours[J]. Oncogene, 2000, 19(16): 2060-2066. [Google Scholar]
- Bonora E, Porcelli A M, Gasparre G, et al. Defective oxidative phosphorylation in thyroid oncocytic carcinoma is associated with pathogenic mitochondrial DNA mutations affecting complexes I and Ⅲ[J]. Cancer Research, 2006, 66(12): 6087-6096. [Google Scholar]
- Gasparre G, Porcelli A M, Bonora E, et al. Disruptive mitochondrial DNA mutations in complex I subunits are markers of oncocytic phenotype in thyroid tumors[J]. Proceedings of the National Academy of Sciences of the United States of America, 2007, 104(21): 9001-9006. [Google Scholar]
- Máximo V, Sobrinho-Simões M. Mitochondrial DNA 'common' deletion in Hürthle cell lesions of the thyroid[J]. The Journal of Pathology, 2000, 192(4): 561-562. [Google Scholar]
- Wredenberg A, Wibom R, Wilhelmsson H, et al. Increased mitochondrial mass in mitochondrial myopathy mice[J]. Proceedings of the National Academy of Sciences of the United States of America, 2002, 99(23): 15066-15071. [Google Scholar]
- Goffredo P, Roman S A, Sosa J A. Hurthle cell carcinoma: A population-level analysis of 3311 patients[J]. Cancer, 2013, 119(3): 504-511. [Google Scholar]
- Chindris A M, Casler J D, Bernet V J, et al. Clinical and molecular features of Hürthle cell carcinoma of the thyroid[J]. The Journal of Clinical Endocrinology and Metabolism, 2015, 100(1): 55-62. [Google Scholar]
- Shaha A R, Shah J P, Loree T R. Patterns of nodal and distant metastasis based on histologic varieties in differentiated carcinoma of the thyroid[J]. The American Journal of Surgery, 1996, 172(6): 692-694. [Google Scholar]
- Haigh P I, Urbach D R. The treatment and prognosis of Hürthle cell follicular thyroid carcinoma compared with its non-Hürthle cell counterpart[J]. Surgery, 2005, 138(6): 1152-1158. [Google Scholar]
- Kushchayeva Y, Duh Q Y, Kebebew E, et al. Comparison of clinical characteristics at diagnosis and during follow-up in 118 patients with Hürthle cell or follicular thyroid cancer[J]. The American Journal of Surgery, 2008, 195(4): 457-462. [Google Scholar]
- Hundahl S A, Fleming I D, Fremgen A M, et al. A national cancer data base report on 53 856 cases of thyroid carcinoma treated in the U.S., 1985-1995[J]. Cancer, 1998, 83(12): 2638-2648. [Google Scholar]
- Ahmadi S, Stang M, Jiang X, et al. Hürthle cell carcinoma: Current perspectives[J]. OncoTargets and Therapy, 2016, 9: 6873-6884. [Google Scholar]
- Yutan E, Clark O H. Hürthle cell carcinoma[J]. Current Treatment Options in Oncology, 2001, 2(4): 331-335. [Google Scholar]
- Oluic B, Paunovic I, Loncar Z, et al. Survival and prognostic factors for survival, cancer specific survival and disease free interval in 239 patients with Hürthle cell carcinoma: A single center experience[J]. BMC Cancer, 2017, 17(1): 371. [Google Scholar]
- Petric R, Gazic B, Besic N. Prognostic factors for disease-specific survival in 108 patients with Hürthle cell thyroid carcinoma: A single-institution experience[J]. BMC Cancer, 2014, 14: 777. [Google Scholar]
- Mills S C, Haq M, Smellie W J B, et al. Hürthle cell carcinoma of the thyroid: Retrospective review of 62 patients treated at the royal marsden hospital between 1946 and 2003[J]. European Journal of Surgical Oncology, 2009, 35(3): 230-234. [Google Scholar]
- Ucal Y, Ozpinar A. Proteomics in thyroid cancer and other thyroid-related diseases: A review of the literature[J]. Biochimica et Biophysica Acta (BBA) - Proteins and Proteomics, 2020, 1868(11): 140510. [Google Scholar]
- Shao W G, Guo T N, Toussaint N C, et al. Comparative analysis of mRNA and protein degradation in prostate tissues indicates high stability of proteins[J]. Nature Communications, 2019, 10(1): 2524. [Google Scholar]
- Jiang L H, Wang M, Lin S, et al. A quantitative proteome map of the human body[J]. Cell, 2020, 183(1): 269-283.e19. [Google Scholar]
- Sun Y T, Selvarajan S, Zang Z L, et al. Artificial intelligence defines protein-based classification of thyroid nodules[J]. Cell Discovery, 2022, 8(1): 85. [Google Scholar]
- Chen T, Ma J, Liu Y, et al. iProX in 2021: Connecting proteomics data sharing with big data[J]. Nucleic Acids Research, 2022, 50(D1): D1522-D1527. [Google Scholar]
- Consortium T U. UniProt: The universal protein knowledgebase[J]. Nucleic Acids Research, 2017, 45(D1): D158-D169. [Google Scholar]
- Shen W T, Song Z G, Zhong X, et al. Sangerbox: A comprehensive, interaction-friendly clinical bioinformatics analysis platform[J]. iMeta, 2022, 1(3): e36. [Google Scholar]
- Sherman B T, Hao M, Qiu J, et al. DAVID: A web server for functional enrichment analysis and functional annotation of gene lists (2021 update)[J]. Nucleic Acids Research, 2022, 50(W1): W216-W221. [Google Scholar]
- Szklarczyk D, Kirsch R, Koutrouli M, et al. The STRING database in 2023: Protein-protein association networks and functional enrichment analyses for any sequenced genome of interest[J]. Nucleic Acids Research, 2023, 51(D1): D638-D646. [Google Scholar]
- Shannon P, Markiel A, Ozier O, et al. Cytoscape: A software environment for integrated models of biomolecular interaction networks[J]. Genome Research, 2003, 13(11): 2498-2504. [Google Scholar]
- Zhou G Y, Soufan O, Ewald J, et al. NetworkAnalyst 3.0: A visual analytics platform for comprehensive gene expression profiling and meta-analysis[J]. Nucleic Acids Research, 2019, 47(W1): W234-W241. [Google Scholar]
- Davis C A, Hitz B C, Sloan C A, et al. The encyclopedia of DNA elements (ENCODE): Data portal update[J]. Nucleic Acids Research, 2018, 46(D1): D794-D801. [Google Scholar]
- Liu Z P, Wu C L, Miao H Y, et al. RegNetwork: An integrated database of transcriptional and post-transcriptional regulatory networks in human and mouse[J]. Database, 2015, 2015: bav095. [Google Scholar]
- Piñero J, Bravo À, Queralt-Rosinach N, et al. DisGeNET: A comprehensive platform integrating information on human disease-associated genes and variants[J]. Nucleic Acids Research, 2017, 45(D1): D833-D839. [Google Scholar]
- Wishart D S, Feunang Y D, Guo A C, et al. DrugBank 5.0: A major update to the DrugBank database for 2018[J]. Nucleic Acids Research, 2018, 46(D1): D1074-D1082. [Google Scholar]
- Yang X M, Wang X Q, Hu L P, et al. Nucleolar HEAT repeat containing 1 up-regulated by the mechanistic target of rapamycin complex 1 signaling promotes hepatocellular carcinoma growth by dominating ribosome biogenesis and proteome homeostasis[J]. Gastroenterology, 2023, 165(3): 629-646. [Google Scholar]
- Penzo M, Montanaro L, Treré D, et al. The ribosome biogenesis-cancer connection[J]. Cells, 2019, 8(1): 55. [Google Scholar]
- Narla A, Ebert B L. Ribosomopathies: Human disorders of ribosome dysfunction[J]. Blood, 2010, 115(16): 3196-3205. [Google Scholar]
- Stelzer G, Rosen N, Plaschkes I, et al. The GeneCards suite: From gene data mining to disease genome sequence analyses[J]. Current Protocols in Bioinformatics, 2016, 54(1): 1.30.1-1.30.33. [Google Scholar]
- Máximo V, Botelho T, Capela J, et al. Somatic and germline mutation in GRIM-19, a dual function gene involved in mitochondrial metabolism and cell death, is linked to mitochondrion-rich (Hürthle cell) tumours of the thyroid[J]. British Journal of Cancer, 2005, 92(10): 1892-1898. [Google Scholar]
- Chouhan S, Sawant M, Weimholt C, et al. TNK2/ACK1-mediated phosphorylation of ATP5F1A (ATP synthase F1 subunit alpha) selectively augments survival of prostate cancer while engendering mitochondrial vulnerability[J]. Autophagy, 2023, 19(3): 1000-1025. [Google Scholar]
- Sharma R K, Chafik A, Bertolin G. Aurora kinase A/AURKA functionally interacts with the mitochondrial ATP synthase to regulate energy metabolism and cell death[J]. Cell Death Discovery, 2023, 9(1): 203. [Google Scholar]
- Ba Y S, Ma F W, Ma Y W, et al. ATP5A1 participates in transcriptional and posttranscriptional regulation of cancer-associated genes by modulating their expression and alternative splicing profiles in HeLa cells[J]. Technology in Cancer Research & Treatment, 2021, 20: 15330338211039126. [Google Scholar]
- Yuan L S, Chen L, Qian K Y, et al. A novel correlation between ATP5A1 gene expression and progression of human clear cell renal cell carcinoma identified by co-expression analysis[J]. Oncology Reports, 2018, 39(2): 525-536. [Google Scholar]
- Repetto O, De Re V, Giuffrida P, et al. Proteomics signature of autoimmune atrophic gastritis: Towards a link with gastric cancer[J]. Gastric Cancer, 2021, 24(3): 666-679. [Google Scholar]
- Zhang G F, Zhong J M, Lin L, et al. Loss of ATP5A1 enhances proliferation and predicts poor prognosis of colon adenocarcinoma[J]. Pathology–Research and Practice, 2022, 230: 153679. [Google Scholar]
- Yue L Y, Liu P, Ma N T, et al. Interaction between extracellular ATP5A1 and LPS alleviates LPS-induced neuroinflammation in mice[J]. Neuroscience Letters, 2021, 758: 136005. [Google Scholar]
- Lines M A, Cuillerier A, Chakraborty P, et al. A recurrent de novo ATP5F1A substitution associated with neonatal complex V deficiency[J]. European Journal of Human Genetics, 2021, 29(11): 1719-1724. [Google Scholar]
- Nasca A, Mencacci N E, Invernizzi F, et al. Variants in ATP5F1B are associated with dominantly inherited dystonia[J]. Brain, 2023, 146(7): 2730-2738. [Google Scholar]
- Slater K, Bosch R, Smith K F, et al. 1, 4-dihydroxy quininib modulates the secretome of uveal melanoma tumour explants and a marker of oxidative phosphorylation in a metastatic xenograft model[J]. Frontiers in Medicine, 2023, 9: 1036322. [Google Scholar]
- Mahdevar M, Vatandoost J, Seyed Forootan F, et al. Steroid receptor RNA activator gene footprint in the progression and drug resistance of colorectal cancer through oxidative phosphorylation pathway[J]. Life Sciences, 2021, 285: 119950. [Google Scholar]
- Fiorillo M, Scatena C, Naccarato A G, et al. Bedaquiline, an FDA-approved drug, inhibits mitochondrial ATP production and metastasis in vivo, by targeting the gamma subunit (ATP5F1C) of the ATP synthase[J]. Cell Death and Differentiation, 2021, 28(9): 2797-2817. [Google Scholar]
- Song K H, Kim J H, Lee Y H, et al. Mitochondrial reprogramming via ATP5H loss promotes multimodal cancer therapy resistance[J]. The Journal of Clinical Investigation, 2018, 128(9): 4098-4114. [Google Scholar]
- Boada M, Antúnez C, Ramírez-Lorca R, et al. ATP5H/KCTD2 locus is associated with Alzheimer's disease risk[J]. Molecular Psychiatry, 2014, 19(6): 682-687. [Google Scholar]
- Zavileyskiy L, Bunik V. Regulation of p53 function by formation of non-nuclear heterologous protein complexes[J]. Biomolecules, 2022, 12(2): 327. [Google Scholar]
- Bottani E, Cerutti R, Harbour M E, et al. TTC19 plays a husbandry role on UQCRFS1 turnover in the biogenesis of mitochondrial respiratory complex Ⅲ[J]. Molecular Cell, 2017, 67(1): 96-105.e4. [Google Scholar]
- Yu J, Liang Q Y, Wang J, et al. Zinc-finger protein 331, a novel putative tumor suppressor, suppresses growth and invasiveness of gastric cancer[J]. Oncogene, 2013, 32(3): 307-317. [Google Scholar]
- Owens K M, Kulawiec M, Desouki M M, et al. Impaired OXPHOS complex Ⅲ in breast cancer[J]. PLoS One, 2011, 6(8): e23846. [Google Scholar]
- Natrajan R, MacKay A, Wilkerson P M, et al. Functional characterization of the 19q12 amplicon in grade Ⅲ breast cancers[J]. Breast Cancer Research, 2012, 14(2): R53. [Google Scholar]
- Becherini P, Caffa I, Piacente F, et al. SIRT6 enhances oxidative phosphorylation in breast cancer and promotes mammary tumorigenesis in mice[J]. Cancer & Metabolism, 2021, 9(1): 6. [Google Scholar]
- Nordlund J, Milani L, Lundmark A, et al. DNA methylation analysis of bone marrow cells at diagnosis of acute lymphoblastic leukemia and at remission[J]. PLoS One, 2012, 7(4): e34513. [Google Scholar]
- Jun K H, Kim S Y, Yoon J H, et al. Amplification of the UQCRFS1 gene in gastric cancers[J]. Journal of Gastric Cancer, 2012, 12(2): 73-80. [Google Scholar]
- Ellinger J, Gromes A, Poss M, et al. Systematic expression analysis of the mitochondrial complex Ⅲ subunits identifies UQCRC1 as biomarker in clear cell renal cell carcinoma[J]. Oncotarget, 2016, 7(52): 86490-86499. [Google Scholar]
- De Marco C, Zoppoli P, Rinaldo N, et al. Genome-wide analysis of copy number alterations led to the characterisation of PDCD10 as oncogene in ovarian cancer[J]. Translational Oncology, 2021, 14(3): 101013. [Google Scholar]
- Ha J H, Jayaraman M, Yan M D, et al. GNAi2/gip2-regulated transcriptome and its therapeutic significance in ovarian cancer[J]. Biomolecules, 2021, 11(8): 1211. [Google Scholar]
- Sun Q R, Li J Q, Dong H, et al. UQCRFS1 serves as a prognostic biomarker and promotes the progression of ovarian cancer[J]. Scientific Reports, 2023, 13(1): 8335. [Google Scholar]
- Bai H Y, Wang Y L, Liu H M, et al. Development of a four-mRNA expression-based prognostic signature for cutaneous melanoma[J]. Frontiers in Genetics, 2021, 12: 680617. [Google Scholar]
- Yusenko M V, Ruppert T, Kovacs G. Analysis of differentially expressed mitochondrial proteins in chromophobe renal cell carcinomas and renal oncocytomas by 2-D gel electrophoresis[J]. International Journal of Biological Sciences, 2010, 6(3): 213-224. [Google Scholar]
- Liu J P, Zhan X Q, Li M Y, et al. Mitochondrial proteomics of nasopharyngeal carcinoma metastasis[J]. BMC Medical Genomics, 2012, 5: 62. [Google Scholar]
- Zeng J, Li G L, Xia Y, et al. miR-204/COX5A axis contributes to invasion and chemotherapy resistance in estrogen receptor-positive breast cancers[J]. Cancer Letters, 2020, 492: 185-196. [Google Scholar]
- Jung S E, Kim S W, Jeong S, et al. MicroRNA-26a/b-5p promotes myocardial infarction-induced cell death by downregulating cytochrome c oxidase 5a[J]. Experimental & Molecular Medicine, 2021, 53(9): 1332-1343. [Google Scholar]
- Stanke K M, Wilson C, Kidambi S. High expression of glycolytic genes in clinical glioblastoma patients correlates with lower survival[J]. Frontiers in Molecular Biosciences, 2021, 8: 752404. [Google Scholar]
- Majercikova Z, Dibdiakova K, Gala M, et al. Different approaches for the profiling of cancer pathway-related genes in glioblastoma cells[J]. International Journal of Molecular Sciences, 2022, 23(18): 10883. [Google Scholar]
- Ganly I, Liu E M, Kuo F S, et al. Mitonuclear genotype remodels the metabolic and microenvironmental landscape of Hürthle cell carcinoma[J]. Science Advances, 2022, 8(25): eabn9699. [Google Scholar]
- Comelli M, Metelli G, Mavelli I. Downmodulation of mitochondrial F0F1 ATP synthase by diazoxide in cardiac myoblasts: A dual effect of the drug[J]. American Journal of Physiology Heart and Circulatory Physiology, 2007, 292(2): H820-H829. [Google Scholar]
- Ravindra K C, Ho W E, Cheng C, et al. Untargeted proteomics and systems-based mechanistic investigation of artesunate in human bronchial epithelial cells[J]. Chemical Research in Toxicology, 2015, 28(10): 1903-1913. [Google Scholar]
All Figures
|
Fig. 1 Flow chart of data screening and analysis |
| In the text | |
|
Fig. 2 Comparative analysis of proteomic expression profiles between different groups (a) Volcano plot showing upregulation (red dots) and downregulation (green dots) between HCC and NOR. (b) Volcano plot showing upregulation (red dots) and downregulation (green dots) between HCA and NOR. |
| In the text | |
|
Fig. 3 Cluster heatmaps of proteomic expression profiles for different groups (a) The red square represents the HCC group, and the blue square represents the NOR group. (b) The yellow square represents the HCA group, and the blue square represents the NOR group. |
| In the text | |
|
Fig. 4 Enrichment analysis of differentially expressed genes between HCC and NOR using GO and KEGG (a) Bubble chart of biological process (BP). (b) Bubble chart of cellular component (CC). (c) Bubble chart of molecular function (MF). (d) Bubble chart of KEGG pathway. |
| In the text | |
|
Fig. 5 Enrichment analysis of differentially expressed genes between HCA and NOR using GO and KEGG (a) Bubble chart of biological process (BP). (b) Bubble chart of cellular component (CC). (c) Bubble chart of molecular function (MF). (d) Bubble chart of KEGG pathway. |
| In the text | |
|
Fig. 6 Protein-protein interaction (PPI) network analysis of DEPs The color of the dots represents the clustering of proteins. The thickness of the connecting line represents the degree of tightness between proteins. (a) The PPI network for HCC vs. NOR-DEPs. (b) The PPI network for HCA vs. NOR-DEPs. |
| In the text | |
|
Fig. 7 Screen out hub genes based on the intersection of two comparisons (HCC vs. NOR and HCA vs. NOR) (a) The Venn diagram shows the intersection of differentially expressed genes of two comparisons. (b) PPI network analysis of 94 intersecting genes. (c) PPI network analysis of the top ten genes among 94 intersecting genes. |
| In the text | |
|
Fig. 8 Receiver operating characteristic (ROC) of hub genes (a) ATP5F1A. (b) ATP5F1B. (c) UQCRFS1. (d) ATP5F1D. (e) ATP5F1C. (f) COX5A. (g) ATP5PD. (h) ATP5PO. (i) SUCLG1. (j) ACO2. (k) The protein expression levels of hub genes in different groups (∗ P<0.05, ∗∗ P<0.01, ∗∗∗ P<0.001, and ∗∗∗∗ P<0.000 1). |
| In the text | |
|
Fig. 9 Transcription factor analysis of hub genes The network of ten hub genes and 39 TFs and 43 miRNAs. The red dots represent genes, the blue dots represent miRNAs, and the yellow dots represent TFs. |
| In the text | |
|
Fig. 10 Analysis of hub genes and diseases The red dots represent genes, and the yellow dots represent diseases. (a) Network of the association between ACO2 and diseases. (b) Network of the association between ATP5B and diseases. |
| In the text | |
|
Fig. 11 Analysis of hub genes and drugs The red dots represent genes, and the orange dots represent drugs. (a) Network of the association between UQCRFS1 and drugs. (b) Network of the association between ATP5B, ATP5A1, and ATP5C1 with drugs. (c) Network of the association between ATP5D and drugs. (d) Network of the association between ACO2 and drugs. |
| In the text | |
|
Fig. 12 Validation of differential expression of ATP5F1B, ATP5F1C, and ATP5PD between HCC, HCA, and NOR in another independent queue (a-c) HCC tissue shows significant upregulation of ATP5F1B, ATP5F1C and ATP5PD compared to HCA tissue. Similarly, compared to NOR tissue, these three genes are significantly upregulated in HCC and HCA. Evaluation of IHC staining is based on the sum of percentage and intensity scores. (d-l) Representative IHC staining of ATP5F1B (d, HCC; e, HCA; f, NOR) and ATP5F1C (g, HCC; h, HCA; i, NOR) and ATP5PD (j, HCC; k, HCA; l, NOR). |
| In the text | |
Current usage metrics show cumulative count of Article Views (full-text article views including HTML views, PDF and ePub downloads, according to the available data) and Abstracts Views on Vision4Press platform.
Data correspond to usage on the plateform after 2015. The current usage metrics is available 48-96 hours after online publication and is updated daily on week days.
Initial download of the metrics may take a while.