Open Access
Fig. 2
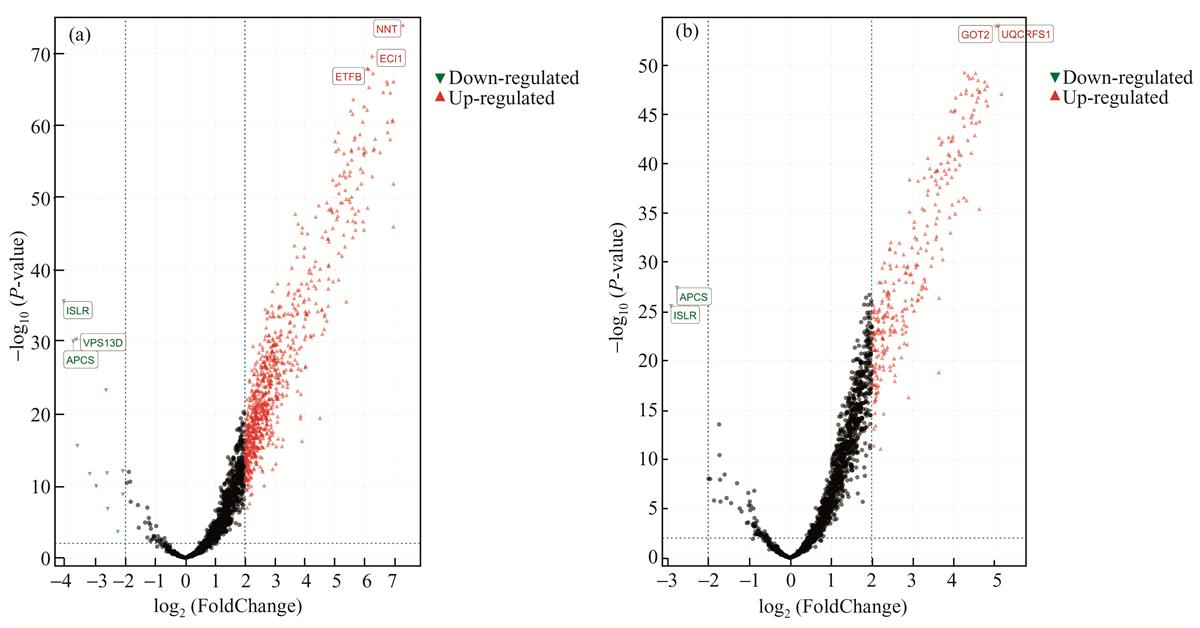
Comparative analysis of proteomic expression profiles between different groups
Download original image
(a) Volcano plot showing upregulation (red dots) and downregulation (green dots) between HCC and NOR. (b) Volcano plot showing upregulation (red dots) and downregulation (green dots) between HCA and NOR.
Current usage metrics show cumulative count of Article Views (full-text article views including HTML views, PDF and ePub downloads, according to the available data) and Abstracts Views on Vision4Press platform.
Data correspond to usage on the plateform after 2015. The current usage metrics is available 48-96 hours after online publication and is updated daily on week days.
Initial download of the metrics may take a while.