Open Access
Fig. 7
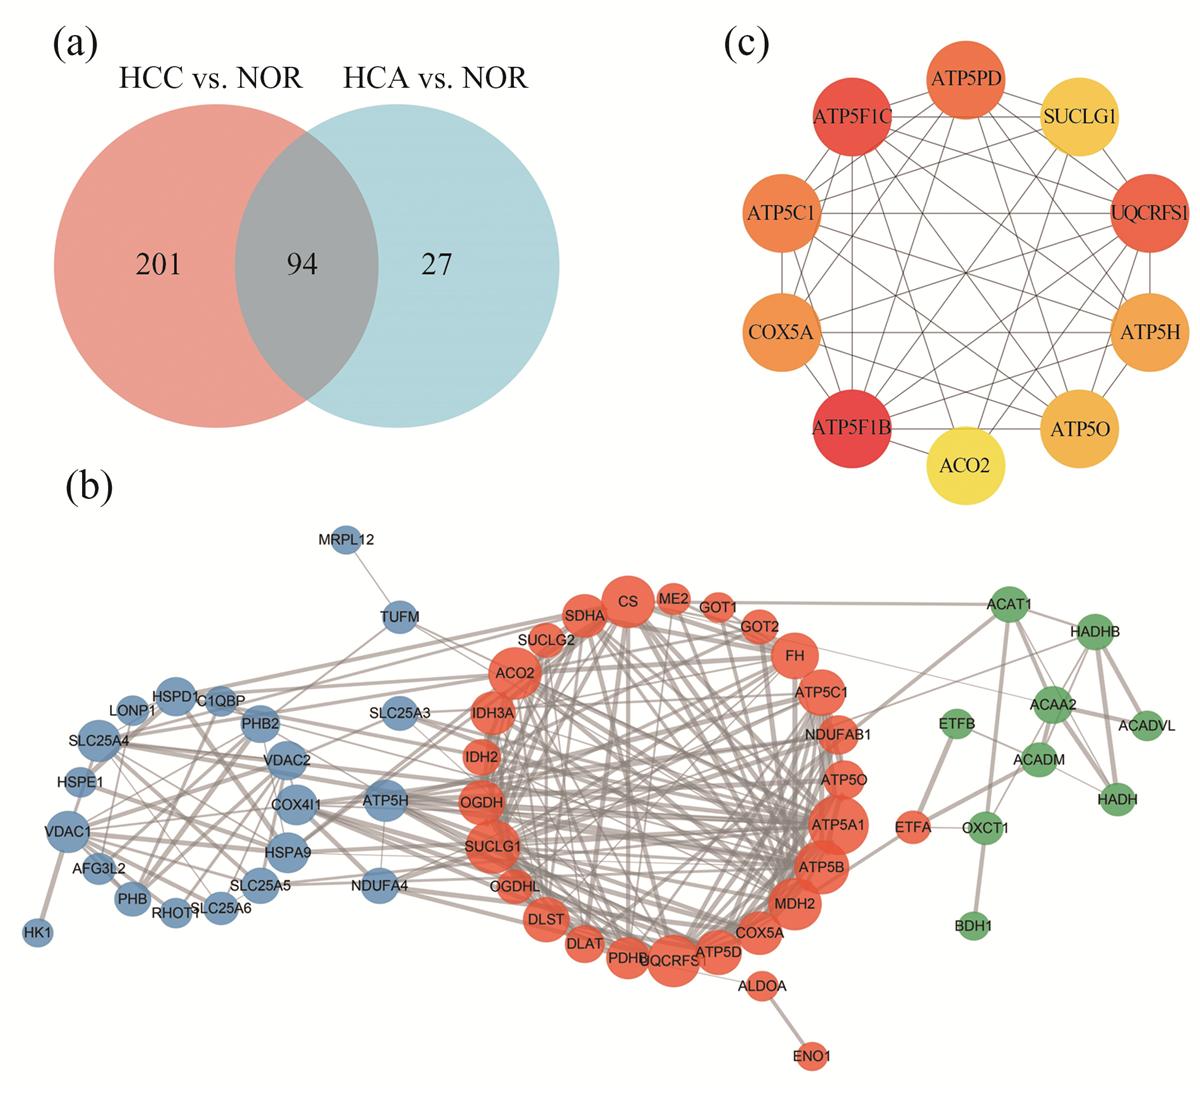
Screen out hub genes based on the intersection of two comparisons (HCC vs. NOR and HCA vs. NOR)
Download original image
(a) The Venn diagram shows the intersection of differentially expressed genes of two comparisons. (b) PPI network analysis of 94 intersecting genes. (c) PPI network analysis of the top ten genes among 94 intersecting genes.
Current usage metrics show cumulative count of Article Views (full-text article views including HTML views, PDF and ePub downloads, according to the available data) and Abstracts Views on Vision4Press platform.
Data correspond to usage on the plateform after 2015. The current usage metrics is available 48-96 hours after online publication and is updated daily on week days.
Initial download of the metrics may take a while.