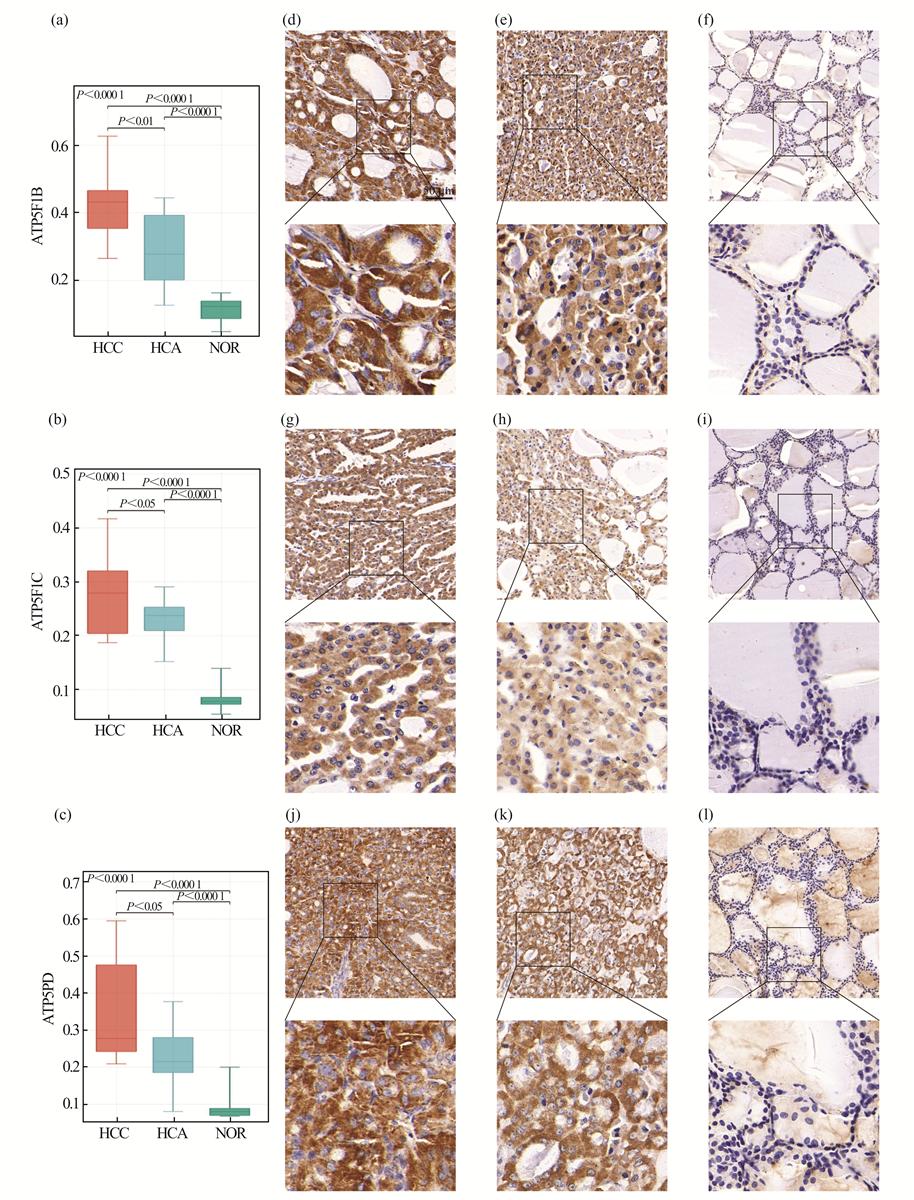
Fig. 12
Validation of differential expression of ATP5F1B, ATP5F1C, and ATP5PD between HCC, HCA, and NOR in another independent queue
Download original image
(a-c) HCC tissue shows significant upregulation of ATP5F1B, ATP5F1C and ATP5PD compared to HCA tissue. Similarly, compared to NOR tissue, these three genes are significantly upregulated in HCC and HCA. Evaluation of IHC staining is based on the sum of percentage and intensity scores. (d-l) Representative IHC staining of ATP5F1B (d, HCC; e, HCA; f, NOR) and ATP5F1C (g, HCC; h, HCA; i, NOR) and ATP5PD (j, HCC; k, HCA; l, NOR).
Current usage metrics show cumulative count of Article Views (full-text article views including HTML views, PDF and ePub downloads, according to the available data) and Abstracts Views on Vision4Press platform.
Data correspond to usage on the plateform after 2015. The current usage metrics is available 48-96 hours after online publication and is updated daily on week days.
Initial download of the metrics may take a while.