| Issue |
Wuhan Univ. J. Nat. Sci.
Volume 31, Number 1, February 2026
|
|
|---|---|---|
| Page(s) | 35 - 44 | |
| DOI | https://doi.org/10.1051/wujns/2026311035 | |
| Published online | 06 March 2026 | |
Deep Learning and Intelligent Perception
CLC number: TP212
An Interpretable Inception-ResNet-Based Method for Intrusion Event Recognition in Distributed Optical Fiber Sensing Systems
一种可解释的基于 Inception-ResNet 的分布式光纤传感入侵事件识别方法
1
School of Optical-Electrical and Computer Engineering, University of Shanghai for Science and Technology, Shanghai 200093, China
(上海理工大学 光电信息与计算机工程学院,上海 200093)
2
Beijing Zhaoxin-Electronic-Technology Co., Ltd, Beijing 100000, China
(北京兆芯电子科技有限公司,北京 100000)
3
Northeast Sichuan Gas Mine, PetroChina Southwest Oil and Gasfield Company, Dazhou 635000, Sichuan, China
(中国石油西南油气田分公司 川东北气矿,四川 达州 635000)
4
The Haixi Extension Service Center for Agricultural and Animal Husbandry Technology, Delingha 810000, Qinghai, China
(青海省德令哈市海西州畜牧兽医科技推广服务中心,青海 德令哈 810000)
† Corresponding author. E-mail: This email address is being protected from spambots. You need JavaScript enabled to view it.
Received:
28
June
2025
Abstract
Distributed optical fiber sensing (DOFS) technology has been widely applied in pipeline monitoring, seismic detection, and security protection due to its broad coverage, high sensitivity, and strong anti-interference capability. However, the acquired signals are typically noisy, exhibit complex temporal-spatial patterns, and contain high-dimensional categorical features, posing significant challenges for robust classification. To address these issues, this paper introduces an Inception-ResNet-based model for intrusion event recognition in DOFS systems. The Inception architecture extracts multi-scale features from complex vibration patterns, while the residual optimization of ResNet enables efficient deep feature propagation and stable training. Furthermore, to enhance model interpretability, a Grad-CAM-based mechanism is integrated to visualize class-discriminative regions in the vibration signals, revealing the patterns that most strongly influence the network's decisions. Extensive experiments demonstrate the effectiveness of the proposed approach, achieving an average classification accuracy of 92.6%, outperforming traditional deep learning networks even with significantly reduced training data. These results indicate that the interpretable Inception-ResNet framework not only accurately classifies complex one-dimensional sensing signals but also provides transparent and reliable support for practical DOFS applications.
摘要
分布式光纤传感(DOFS)技术因其监测范围广、灵敏度高、抗干扰能力强等优势,已广泛应用于管道监测、地震探测和安防预警等领域。然而,系统采集的信号通常噪声强烈、时空模式复杂,并包含维度较高的类别特征,使得准确识别入侵事件面临显著挑战。为此,本文提出了一种基于 Inception-ResNet 的 DOFS 入侵事件识别模型。Inception 模块能够从复杂振动信号中提取多尺度特征,而 ResNet 的残差优化结构则保证了深层特征的高效传播与稳定训练。 此外,为提升模型的可解释性,本文引入了基于 Grad-CAM 的可视化机制,用以突出对分类结果具有关键贡献的信号区域,从而揭示模型决策背后的判据。大量实验结果表明,所提出方法在入侵事件分类任务中取得了 92.6% 的平均准确率,在显著减少训练数据量的条件下仍优于传统深度学习模型。研究结果表明,该可解释的 Inception-ResNet 框架不仅能够有效分类复杂的一维光纤传感信号,也为 DOFS 的实际应用提供了透明、可靠的技术支撑。
Key words: distributed optical fiber sensing system / optical fiber signal processing / deep learning
关键字 : 分布式光纤传感系统 / 光纤信号处理 / 深度学习
Cite this article:GUO Chenxi, WU Di, ZHAI Hailong, et al. An Interpretable Inception-ResNet-Based Method for Intrusion Event Recognition in Distributed Optical Fiber Sensing Systems[J]. Wuhan Univ J of Nat Sci, 2026, 31(1): 35-44.
Biography: GUO Chenxi, female, Undergraduate, research direction: electronical information. E-mail: This email address is being protected from spambots. You need JavaScript enabled to view it.
Foundation item: Supported by the the Academician Workstation Program of Yunnan Province (202405AF140013), High-Quality Development Special Project of the Ministry of Industry and Information Technology (TC240A9ED-56), and Shanghai Agricultural Technology Innovation Project (2024-02-08-00-12-F00032)
© Wuhan University 2026
 This is an Open Access article distributed under the terms of the Creative Commons Attribution License (https://creativecommons.org/licenses/by/4.0), which permits unrestricted use, distribution, and reproduction in any medium, provided the original work is properly cited.
0 Introduction
In recent years, Distributed Acoustic Sensing (DAS) technology has rapidly emerged in industrial and scientific fields due to its wide coverage, high sensitivity, and excellent resistance to electromagnetic interference [1]. As a cutting-edge technology based on fiber-optic communication, DAS uses optical fibers as sensing media to achieve real-time monitoring over large areas through distributed sensing. It has demonstrated unique advantages in applications such as pipeline leak detection[2], seismic activity monitoring[3], bridge and tunnel health monitoring[4], and border security protection[5].
However, the signals acquired by DAS systems are often accompanied by significant noise, complex spatiotemporal characteristics, and imbalanced multi-class distributions. These issues pose severe challenges to the robustness and generalization capability of signal classification algorithms. Traditional signal classification methods can be broadly categorized into two types: the first relies on feature engineering-based machine learning approaches (such as Support Vector Machines, Random Forests, and k-Nearest Neighbors), which often depend on manually designed feature extraction processes. The performance of these methods heavily relies on the quality of the extracted features and struggles to fully exploit deep signal information[6]. The second category utilizes end-to-end deep learning for feature extraction. Models such as Convolutional Neural Networks (CNNs) and Long Short-Term Memory (LSTM) networks fall into this category and perform exceptionally well in image and sequential signal classification by automatically learning data features[7]. In addition, several recent studies have introduced Transformer-based or hybrid lightweight architectures into DAS signal analysis. For example, Li et al[8] proposed a CNN-LSTM-Transformer hybrid network for vibration event recognition in distributed fiber sensing systems, demonstrating enhanced modeling of long-range temporal dependencies. Similarly, Duan et al[9] developed a self-supervised Transformer-based Distributed Acoustic Sensing-Masked Autoencoder framework that achieves high-performance representation learning under limited labeled data. These advances further highlight the growing role of Transformer-style architectures in DAS classification tasks.
Despite the apparent advantages of traditional deep learning methods in automatic feature extraction and high-precision classification, they generally assume that the input data have a fixed and regular structure and require large amounts of labeled data to achieve ideal performance. DAS signals often contain latent non-Euclidean topological relationships, which traditional models struggle to comprehensively capture. Moreover, the high cost of collecting and annotating large-scale datasets further limits the practical application of these conventional methods.
In contrast, in the field of image classification, to address the aforementioned issues, the Inception-ResNet network architecture has been proposed[10]. The Inception module captures multi-scale signal features, enabling flexible handling of diverse patterns. Complementarily, the residual connections in ResNet mitigate the vanishing gradient problem and significantly enhance deep feature extraction. The organic integration of the two not only makes Inception-ResNet more expressive and precise in feature representation but also considerably reduces dependency on large training datasets, maintaining high classification accuracy even with limited data resources.
Extensive experimental results have shown that models based on Inception-ResNet perform excellently in tasks such as object detection and image classification[11]. Even with significantly reduced training data, they achieve stable and efficient classification outcomes. Several improved versions now exist, including Inception-ResNet-v1 and Inception-ResNet-v2. Notably, empirical studies have confirmed that Inception-ResNet-v2 demonstrates a superior ability to capture complex feature representations[12]. Boasting a deeper, wider architecture and more parallel branches than v1, Inception-ResNet-v2 provides a stronger capacity for learning multi-scale features—a crucial characteristic for modeling the noisy and complex patterns in DAS signals. This enhanced representational capacity, despite its higher computational cost, is particularly well-suited for fiber optic signal classification under data-limited conditions.
Against this backdrop, this paper proposes applying a modified Inception-ResNet model to DAS signal classification in distributed fiber-optic sensing. To better suit the characteristics of optical fiber signal data, the architecture is adapted by drastically reducing the network depth—retaining only the Stem, one Inception-ResNet-A, and one Reduction-A module while removing all Inception-B and Inception-C stages—to form a lightweight multi-branch feature extractor and validated through experiments on public datasets. To enhance interpretability, the proposed model is further equipped with an explainable mechanism that highlights critical signal patterns contributing to classification decisions. Consequently, the proposed model achieves significant advantages in multi-class classification tasks, with an average classification accuracy of 92.6%, and outperforms traditional methods in terms of training data requirements.
The main contributions of this paper are as follows:
(1) A lightweight Inception-ResNet architecture is designed for DAS intrusion recognition, achieving high classification accuracy even under limited training data. By reducing the network depth while retaining multi-branch feature extraction, the proposed model significantly alleviates dependence on large-scale labeled datasets and improves learning efficiency in small-sample scenarios.
(2) The model effectively handles high-noise, complex-pattern DAS signals through multi-scale feature extraction and residual-enhanced deep representation learning. This design captures latent multi-level vibration structures and high-dimensional discriminative patterns, thereby improving robustness and generalization performance under challenging sensing conditions.
(3) The improved Inception-ResNet framework is tailored to the non-Euclidean temporal-spatial characteristics of distributed fiber sensing signals and provides an interpretable decision process. By integrating a Gradient-weighted Class Activation Mapping-based visualization mechanism, the model highlights class-specific high-contribution regions in vibration signals, offering transparent and trustworthy explanations of classification results and supporting practical deployment in real DOFS applications.
The structure of this paper is as follows: Section 1 elaborates on the architecture and implementation of the proposed model; Section 2 introduces the experimental setup and provides an analysis and in-depth discussion of the results; finally, Section 3 summarizes the research and presents prospects for future work.
1 Inception-ResNet-Based Vibration Intrusion Recognition Framework
1.1 Distributed Optical Fiber Vibration Sensing System
A distributed acoustic sensing (DAS) system based on Φ-OTDR technology is used to monitor ground vibrations around gas pipelines, as illustrated in Fig.1. The system employs a narrow-linewidth continuous laser, which is first pulse-modulated by an acousto-optic modulator (AOM), with the modulation controlled by a signal from the laser driver. The resulting laser pulses are then amplified using an erbium-doped fiber amplifier (EDFA), passed through a filter to remove noise, and injected into the sensing fiber via a fiber coupler.
 |
Fig.1 Structure of distributed optical fiber vibration sensing system (DVS) |
When the sensing fiber experiences external vibrations, part of the backward Rayleigh-scattered light is reflected back along the fiber to the system. This scattered light is amplified again by the EDFA and ultimately detected by a photodetector, where it is converted into an electrical signal for event detection and analysis.
The intensity of the Rayleigh backscattered light from the disturbance source at distance  along the sensing fiber can be expressed as the vector sum of the amplitudes and phases of the scattering centers within that region:
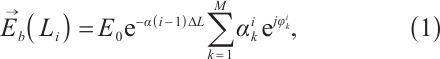
where the backscattered field  in Eq. (1) originates from the coherent superposition of contributions from
  scattering centers within the i-th segment of optical fiber (with length
  ). The incident optical field
  , before reaching the i-th segment, undergoes attenuation described by
  , where
  is the attenuation coefficient of the optical fiber, and
  represents the propagation distance of the light. Each k-th scattering center is characterized by its scattering amplitude
  and phase
  , where the phase is highly sensitive to changes in the round-trip optical path and can thus respond to external disturbances such as strain and temperature.
1.2 Inception-ResNet-Based Model Framework
1.2.1 Inception module
The original Inception structure v1, also known as GoogLeNet, was proposed by Szegedy et al in 2014[13]. As shown in Fig.2, the Inception module—the core of GoogLeNet—uses multiple layers with different filter sizes (1×1, 3×3, and 5×5) and pooling operations in parallel. This architecture allows the network to extract features at multiple scales, capturing complex representations. To reduce computational cost and overfitting while preserving representational power, 1×1 convolutions are applied before the 3×3 and 5×5 convolutions, preventing an explosion in the number of parameters.
 |
Fig.2 Inception module with dimension reductions |
1.2.2 Residual connections
ResNet (Residual Network), proposed by He et al in 2015[14], introduces residual connections in convolutional operations, as shown in Fig.3. Unlike the Inception structure, residual connections directly add the input and the output of the convolution layer under the same channel dimension. This identity mapping enables direct information flow, improving training efficiency.
 |
Fig.3 Residual connections |
1.2.3 Inception-ResNet framework for distributed optical fiber sensing
For a closed-set multi-class classification problem, consider a 1D vibration signal dataset  , containing samples from K known classes. Each sample
  represents a vibration signal, with size depending on the sampling rate and duration of the analog-to-digital conversion. The label
  denotes the class.
As shown in Fig. 4, the proposed framework processes input training samples xi with a shape of 10 000×12×1. It employs an improved Inception-ResNet-V2 architecture, the overall structure of which can be clearly divided into two parts: feature extraction and classification. The feature extraction part is composed of the Stem module, the Inception-ResNet modules, and the Reduction modules, which are detailed below.
 |
Fig.4 Inception-ResNet main framework (Stem, Inception-ResNet, Reduction, GAP, Softmax) |
1) Stem module: Serving as the entry point of the network, it is responsible for rapid preliminary feature extraction and dimensionality reduction of the input raw vibration signals (with a shape of 10 000×12×1).
The structure of the Stem module and input shape changes are illustrated in Fig. 5. It performs six steps: three convolutions, max pooling, two more convolutions, another max pooling, followed by multiscale feature extraction and fusion. All convolutions include batch normalization and activation layers to accelerate convergence and reduce gradient vanishing. The convolution kernel sizes in the length dimension are kept constant, with multiscale filters of sizes 1, 3, and 5. After two rounds of downsampling, the width remains unchanged.
 |
Fig.5 The stem structure includes the input layer, convolutional layers (Conv-1-11), Max pool-1 and Max pool-2, Avg pool-1, and filter concatenation layers The input dimension is |

2) Inception-ResNet module: This is the core of the network. By incorporating multi-scale convolutions (inspired by the Inception concept shown in Fig.2) and residual connections (whose basic unit is shown in Fig.3), it achieves deep fusion and efficient propagation of features.
The Inception-ResNet structure is shown in Fig. 6, containing four branches. The fourth branch uses residual connections instead of simple filter concatenation. The outputs are merged and passed through a 1×1 convolution and multiplied by a scale factor before being added to the input. This scaled residual connection helps improve gradient flow and training stability.
 |
Fig.6 The Inception-ResNet structure comprises ReLU activation, convolutional layers (Conv-12–18), and residual addition Note: Following ReLU activation, the input is split into three branches, processed through Conv-12-17, concatenated via Conv-18, and combined with the original input using a residual connection. Layer parameters and output dimensions are annotated in the figure. |
3) Reduction module (its structure is detailed in Fig.7): At specific stages of the network, this module is responsible for compressing the spatial dimensions of the feature maps while increasing the number of channels, thereby extracting more abstract features.
 |
Fig.7 The reduction structure consists of Max pool-3, convolutional layers (Conv-19–22), a filter concatenation layer, and ReLU activation Layer parameters (kernel size, stride, and padding) and output dimensions are annotated in the figure. |
As illustrated in Fig. 7, the reduction module has three branches and plays a crucial role in downsampling the feature maps' spatial dimensions, reducing memory and computational cost, and increasing channel numbers. By compressing spatial information, it enables the network to learn more abstract and richer features in deeper layers.
Following the aforementioned feature extraction process, the classification part consists of a global average pooling (GAP) layer, a Dropout layer, and a Softmax layer. The final output shape of the network is 1×1×6, representing the predicted probability for each class.
The original Inception-ResNet-V2 was designed for the 1 000-class classification task of ImageNet and is extremely deep. However, the dataset used in this study contains only 6 classes. Therefore, we significantly reduced the network depth to prevent overfitting and improve efficiency. The proposed network is derived from the Inception-ResNet-V2 architecture, but a depth-reduced design was adopted to better match the characteristics of fiber-optic intrusion signals. While the original Inception-ResNet-V2 contains five Inception-A modules, ten Inception-B modules, five Inception-C modules, and two reduction blocks, our model retains only the Stem block, a single Inception-ResNet-A module, and the Reduction-A block. All Inception-B and Inception-C stages were removed, which significantly decreases the number of layers and parameters while preserving the multi-branch feature aggregation mechanism that is essential for representing distributed vibration patterns.
Our proposed model learns a mapping function  through forward propagation. The Stem layer is defined as:

where  is the input tensor representing the fiber vibration signal, producing the initial feature map
  . The Inception-ResNet layer is defined as:


where  are the outputs from different branches that capture local, medium, and global features. The Reduction layer is then defined as:

which downsamples the feature map to obtain  with more channels. After classification, the final output is:

where θ represents the model parameters, which specifically include the weight matrix W and the bias vector b of the final fully-connected layer, x is the sampled vibration signal, and GAP denotes global average pooling.
1.2.4 Categorical cross-entropy loss
Since this task is a multi-class classification problem, we adopt the classification cross-entropy loss as the loss function of the model. This loss function can effectively measure the difference between the predicted probability distribution output by the model and the true label, thereby guiding the model to learn more discriminative feature representations during the training process. The formula for classification cross-entropy loss is defined as follows:

where  represents the number of samples in a batch,
  represents the total number of categories (in this article,
 ),
),  is the true label (one-hot encoding) of the i-th sample on the k-th class;
  is the predicted probability of the model that the i-th sample belongs to the k-th category.
1.3 Grad-CAM-Based Interpretability Analysis
To improve interpretability, a Grad-CAM-based mechanism is incorporated to visualize class-discriminative regions in the vibration signals. Let
▪ denote the
  feature map (with height
  and width
  ) extracted from a chosen convolutional layer,
▪  represent the pre-softmax class score for category
  , and
, and
▪  be the spatial normalization factor.
(1) Compute gradients of class score w.r.t. feature maps
The importance of each channel  to class
  is measured by the gradient of
  with respect to each spatial location in
  :
:

(2) Compute channel-wise weights via global average pooling of gradients
The channel importance weight  is obtained by averaging the gradients over all spatial locations:

This operation reflects the overall contribution of feature map  to the activation of class
  .
.
(3) Generate the Grad-CAM heatmap
The class-specific heatmap  is computed as the weighted linear combination of all feature maps, followed by a ReLU nonlinearity to retain only positive contributions:

Here,  is the total number of channels in the chosen convolutional layer.
(4) Upsampling and overlay
The heatmap is then normalized and upsampled from size  to match the original signal representation (e.g., 10 000×12), using bilinear interpolation:

Finally, the upsampled heatmap is superimposed onto the corresponding signal segment to highlight the regions with the greatest influence on the classification results.
This detailed Grad-CAM formulation enables transparent analysis of how the network distinguishes between different intrusion events by revealing class-specific high-contribution regions in the vibration signals.
2 Experimental Results and Analysis
2.1 Dataset Construction and Signal Processing
In this experiment, we utilized a publicly available dataset[15], which contains a large number of samples across six categories: background, dig, knock, water, shake, and walk. In the initial experiment, 500 samples were randomly selected from each category, resulting in a total of 3 000 samples.
As illustrated in Fig. 8, in order to better adapt to the Inception-ResNet network, preprocessing was applied to the fiber optic sensing vibration signals. To enhance input consistency and accelerate convergence, each raw vibration signal was first normalized using Min-Max scaling:

 |
Fig. 8 Grayscale representation |
The resulting values were subsequently scaled to the grayscale range of  and converted to 8-bit integer format. This preprocessing generates grayscale signal images that are compatible with the Inception-ResNet network. This 2D representation enables the Inception-ResNet network to exploit multi-scale spatial convolutions (1×1, 3×3, 5×5), allowing it to capture local transients, medium-scale oscillations, and long-range temporal patterns simultaneously. Compared with a 1D CNN, which relies solely on linear temporal kernels, the 2D encoding provides richer receptive-field diversity and improves the separability of vibration event patterns. This design choice was empirically validated in our experiments, where the 2D grayscale representation yielded superior classification accuracy under the same network depth.
2.2 Classification Performance Testing
The purpose of this experiment is to evaluate whether the proposed Inception-ResNet network model can achieve the expected results with a significantly reduced training dataset and no additional anomalous signal inputs. The results are compared with those from other deep learning models based on classical convolutional neural networks.
First, 300 samples from each category (60% of the total dataset) were randomly selected as the training set, with the remaining 40% used as the test set. During model training, we used a batch size of 16 and adopted the cosine annealing learning rate schedule[16], starting from 0.02 and decaying gradually to 0 over 200 epochs.
To more accurately reflect the model's performance, accuracy was used as an evaluation metrics, defined as follows:


where TP denotes true positives, FP false positives, TN true negatives, and FN false negatives.
As shown in Fig. 9 and Fig. 10, the evaluation metrics and loss decrease curve respectively demonstrate that after around 100 training epochs, the accuracy exceeded 90% and stabilized thereafter, reaching as high as 92.6%. A detailed analysis of Fig. 11 reveals that the proposed model achieves consistently high classification accuracy across all six categories. The learned feature representations exhibit high class separability, reflecting the model's strong discriminative capability. Nevertheless, certain confusion patterns can still be observed. A small proportion of background samples are misclassified as walk, which is likely due to their similar low-intensity vibration amplitudes and ambient noise levels under both conditions. More noticeable confusion occurs between water and shake, as both classes produce oscillatory waveforms with overlapping frequency ranges and comparable temporal continuity, leading to partial overlap in the learned feature space. In contrast, knock signals are characterized by short-duration, high-amplitude transients that create distinctive temporal sparsity, allowing the model to capture them robustly and achieve a 100% recall. The relatively lower recall of the walk class (0.84) indicates greater intra-class variability, which may arise from irregular human step intervals or signal attenuation along the sensing fiber.
 |
Fig.9 The change trend of accuracy |
 |
Fig.10 The change trend of loss with epochs |
 |
Fig.11 Confusion matrix |
To analyze the Grad-CAM heatmaps (as shown in Fig. 12), we leverage the principle that warm colors (red and yellow) indicate regions with high contribution to the model's classification. The results demonstrate that the model captures semantically meaningful features, with each class's attention regions corresponding to visually distinct patterns in the original signals. Moreover, the attention regions vary across classes, suggesting that the model relies on unique combinations of spatial layout, texture, and amplitude distribution to differentiate between classes. These distinct attention patterns demonstrate the model's interpretability and confirm that it bases its decisions on semantically relevant features, which underpins its reliable classification performance.
 |
Fig.12 Visualization of model attention on fiber-optic vibration signals using Grad-CAM |
A two-dimensional feature output layer was added at the end of the network to visualize the distribution of different event types in 2D space, as shown in Fig. 13. To comprehensively evaluate the performance of the proposed model, we compared it with several representative baseline methods under the same experimental setup. These baselines include a one-dimensional convolutional neural network (CNN), VGG-16, ResNet, and a traditional Support Vector Machine (SVM). All models were trained and tested using the identical dataset split (60% training, 40% testing) and the same preprocessing pipeline. The classification accuracies of all models are summarized in Table 1.
 |
Fig.13 Test set data distribution |
Table 1 summarizes the classification performance of all models under identical experimental conditions. It clearly highlights the superior performance of our proposed model compared to other feature extraction networks, particularly under significantly reduced training data. A quantitative comparison shows that our model achieves the highest accuracy of 92.6%, which represents improvements of 14.0, 6.8, 4.8, and 2.4 percentage points over the SVM, CNN, VGG-16, and ResNet baselines, respectively.
Accuracy under different models and methods (unit:%)
3 Conclusion
This paper proposes a feature extraction network based on Inception-Net-V2 and designs a model framework suitable for DVS (Distributed Vibration Sensing) signal classification. Using a publicly available dataset as experimental support, the results demonstrate that the proposed model performs exceptionally well in closed-set classification, even with a significantly reduced training set, greatly enhancing the model's recognition capability. The model improves effectiveness and robustness in real-world applications and presents a promising direction for future research on small-sample models.
Future work will explore integrating attention mechanisms or Transformer modules into the Inception-ResNet architecture to further enhance feature extraction. In addition, research will focus on developing lightweight model structures to meet real-time online monitoring or edge computing needs while minimizing data usage.
References
- He Z Y, Liu Q W. Optical fiber distributed acoustic sensors: A review[J]. Journal of Lightwave Technology, 2021, 39(12): 3671-3686. [Google Scholar]
- Fu S C, Zhang D, Peng Y, et al. A simulation of gas pipeline leakage monitoring based on distributed acoustic sensing[J]. Measurement Science and Technology, 2022, 33(9): 095108. [Google Scholar]
- Fernández-Ruiz M R, Soto M A, Williams E F, et al. Distributed acoustic sensing for seismic activity monitoring[J]. APL Photonics, 2020, 5(3): 030901. [Google Scholar]
- Wu Y Y, Gao L, Chai J, et al. Overview of health-monitoring technology for long-distance transportation pipeline and progress in DAS technology application[J]. Sensors, 2024, 24(2): 413. [Google Scholar]
- Zhong R J, Chen S K, Liu Z Q, et al. Intrusion identification method for φ-OTDR systems based on few-shot and multi-task learning[C]//2024 IEEE 6th Advanced Information Management, Communicates, Electronic and Automation Control Conference (IMCEC). New York: IEEE, 2024: 1353-1360. [Google Scholar]
- Kandamali D F, Cao X M, Tian M L, et al. Machine learning methods for identification and classification of events in φ-OTDR systems: A review[J]. Applied Optics, 2022, 61(11): 2975-2997. [Google Scholar]
- Wang M, Feng H, Qi D Z, et al. φ-OTDR pattern recognition based on CNN-LSTM[J]. Optik, 2023, 272: 170380. [Google Scholar]
- Li J, Wang L Q, Liu J, et al. Distributed fiber optic vibration sensing event recognition method based on CNN-LSTM-transformer net[J]. Wuhan University Journal of Natural Sciences, 2025, 30(4): 321-333. [Google Scholar]
- Duan J Y, Chen J G, He Z Y. DAS-MAE: A self-supervised pre-training framework for universal and high-performance representation learning of distributed fiber-optic acoustic sensing[EB/OL]. [2025-06-05]. arXiv:2506.04552. [Google Scholar]
- Szegedy C, Ioffe S, Vanhoucke V, et al. Inception-v4, inception-ResNet and the impact of residual connections on learning[J]. Proceedings of the AAAI Conference on Artificial Intelligence, 2017, 31(1): 4278-4284. [Google Scholar]
- Paul S, Das R, Malviya V, et al. Comparative analysis of transfer learning and few-shot learning with CNN architectures for chest X-ray classification under data constraints[J]. Informatica, 2025, 49(4): 1-12. [Google Scholar]
- Umapathi K, Vanithamani R, Priya L, et al. Effective skin cancer classification by modified and optimized inception-ResNet-V2 model[J]. Scientific Reports, 2025, 15(1): 41150. [Google Scholar]
- Szegedy C, Liu W, Jia Y Q, et al. Going deeper with convolutions[C]//2015 IEEE Conference on Computer Vision and Pattern Recognition (CVPR). New York: IEEE, 2015: 1-9. [Google Scholar]
- He K M, Zhang X Y, Ren S Q, et al. Deep residual learning for image recognition[C]//2016 IEEE Conference on Computer Vision and Pattern Recognition (CVPR). New York: IEEE, 2016: 770-778. [Google Scholar]
- Cao X M, Su Y S, Jin Z Y, et al. An open dataset of φ-OTDR events with two classification models as baselines[J]. Results in Optics, 2023, 10: 100372. [Google Scholar]
- Loshchilov I, Hutter F. SGDR: Stochastic gradient descent with warm restarts[EB/OL]. [2024-10-05]. arXiv:1608.03983. [Google Scholar]
All Tables
All Figures
|
Fig.1 Structure of distributed optical fiber vibration sensing system (DVS) |
| In the text | |
|
Fig.2 Inception module with dimension reductions |
| In the text | |
|
Fig.3 Residual connections |
| In the text | |
|
Fig.4 Inception-ResNet main framework (Stem, Inception-ResNet, Reduction, GAP, Softmax) |
| In the text | |
|
Fig.5 The stem structure includes the input layer, convolutional layers (Conv-1-11), Max pool-1 and Max pool-2, Avg pool-1, and filter concatenation layers The input dimension is |
| In the text | |
|
Fig.6 The Inception-ResNet structure comprises ReLU activation, convolutional layers (Conv-12–18), and residual addition Note: Following ReLU activation, the input is split into three branches, processed through Conv-12-17, concatenated via Conv-18, and combined with the original input using a residual connection. Layer parameters and output dimensions are annotated in the figure. |
| In the text | |
|
Fig.7 The reduction structure consists of Max pool-3, convolutional layers (Conv-19–22), a filter concatenation layer, and ReLU activation Layer parameters (kernel size, stride, and padding) and output dimensions are annotated in the figure. |
| In the text | |
|
Fig. 8 Grayscale representation |
| In the text | |
|
Fig.9 The change trend of accuracy |
| In the text | |
|
Fig.10 The change trend of loss with epochs |
| In the text | |
|
Fig.11 Confusion matrix |
| In the text | |
|
Fig.12 Visualization of model attention on fiber-optic vibration signals using Grad-CAM |
| In the text | |
|
Fig.13 Test set data distribution |
| In the text | |
Current usage metrics show cumulative count of Article Views (full-text article views including HTML views, PDF and ePub downloads, according to the available data) and Abstracts Views on Vision4Press platform.
Data correspond to usage on the plateform after 2015. The current usage metrics is available 48-96 hours after online publication and is updated daily on week days.
Initial download of the metrics may take a while.