


| Issue |
Wuhan Univ. J. Nat. Sci.
Volume 31, Number 3, June 2026
|
|
|---|---|---|
| Page(s) | 299 - 304 | |
| DOI | https://doi.org/10.1051/wujns/2026313299 | |
| Published online | 24 June 2026 | |
Engineering Technology
CLC number: V231.2
Research on the Fuel Flow Distribution of Nozzles of the Fuel Injection Rings in Micro-Turbojet Engines
微型涡喷发动机喷油环喷嘴燃油流量分布研究
1
School of Automotive and Transportation, Shenzhen Polytechnic University, Shenzhen 518055, Guangdong, China
(深圳职业技术大学 汽车与交通学院,广东 深圳 518055)
2
School of Aircraft Engineering, Nanchang Hangkong University, Nanchang 330063, Jiangxi, China
(南昌航空大学 飞行器工程学院,江西 南昌 330063)
3
School of Electrical Engineering, Nanchang Institute of Technology, Nanchang 330099, Jiangxi, China
(江西水利电力大学 电气工程学院,江西 南昌 330099)
Received:
21
October
2024
Abstract
The injection ring is a critical component for supplying fuel to the combustion chamber of an engine. The performance of the engine is directly affected by the uniformity of the outlet fuel flow distribution of the nozzle. To address the issue of the uneven outlet fuel flow distribution of nozzles of the injection ring, this paper uses the ANSYS Fluent for numerical simulations. The fuel flow values at each nozzle outlet of the injection ring and the pressure drop between the inlet and outlet were calculated, and the influence of inlet flow and nozzle inner diameter on the fuel flow distribution and the pressure drop between the inlet and outlet were analyzed. The research results indicate that reducing the nozzle inner diameter and increasing the inlet flow lead to a more uniform fuel flow distribution at the nozzle outlets. Additionally, decreasing the nozzle inner diameter increases the pressure drop between the inlet and outlet. The Leiting LT70 micro-turbojet engine discussed in this paper is compatible with an injection ring with a nozzle inner diameter of 600 μm.
摘要
喷油环是为发动机燃烧室供给燃油的关键部件,喷嘴出口燃油流量分布的均匀性直接影响发动机性能。针对喷油环喷嘴出口燃油流量分布不均匀的问题,本文采用ANSYS Fluent软件进行数值模拟,计算得到喷油环各喷嘴出口的燃油流量值及进出口压降,并分析了进口流量和喷嘴内径对燃油流量分布及进出口压降的影响。研究结果表明:减小喷嘴内径、增大进口流量,可使喷嘴出口的燃油流量分布更加均匀;此外,喷嘴内径减小会导致进出口压降增大。本文所研究的雷霆LT70微型涡喷发动机适配喷嘴内径为600μm的喷油环。
Key words: micro-turbojet engine / numerical simulation / fuel nozzle / flow distribution
关键字 : 微型涡喷发动机 / 数值模拟 / 燃油喷嘴 / 流量分布
Cite this article: CHENG Wenming, LIU Jia, ZHANG Yuxing, et al. Research on the Fuel Flow Distribution of Nozzles of the Fuel Injection Rings in Micro-Turbojet Engines[J]. Wuhan Univ J of Nat Sci, 2026, 31(3): 299-304.
Biography: CHENG Wenming, male, Ph.D., research direction: energy and power engineering technology. E-mail: This email address is being protected from spambots. You need JavaScript enabled to view it.
Foundation item: Supported by the Scientific Research Startup Fund for Shenzhen High-Caliber Personnel of SZPU (6026330003K)
© Wuhan University 2026
 This is an Open Access article distributed under the terms of the Creative Commons Attribution License (https://creativecommons.org/licenses/by/4.0), which permits unrestricted use, distribution, and reproduction in any medium, provided the original work is properly cited.
0 Introduction
The fuel injection ring is a crucial component in the fuel supply system of micro-turbojet engines. Its primary function is to deliver fuel stably and uniformly from the fuel tank or fuel supply system to the combustion chamber of the engine[1]. During this process, the parameters of the fuel injection ring, such as fuel flow rate, pressure, and injection angle are needed to meet the engine's requirements to guarantee the normal operation and high efficiency performance of the engine. Improper design of the distribution, size, or shape of the fuel injection holes in the fuel injection ring may lead to uneven fuel distribution during injection progress. Uneven fuel supply can result in a series of issues, such as a decrease in combustion efficiency, a decrease in engine power, an increase in fuel consumption, an increase in emissions pollution, the overheating of the engine, the aggravation of the engine abrasion, flight safety risks and so on[2]. Therefore, it is essential to ensure the uniformity of fuel supply from the fuel injection ring to maintain the normal operation and high performance of the engine.
With regard to the issue of engine fuel injection, extensive research has been conducted[3-4]. Do et al[5] investigated the impact of relatively low inlet flow rate and fuel types on the fuel flow distribution at the nozzle outlet. Enagi et al[6] studied the influence of various nozzle diameters on the combustion characteristics of liquid fuels. Tan et al[7] adopted the scheme with unequal-diameter nozzles, in which the sizes of the nozzles were altered in the fuel injection ring to compensate for pressure loss effects. Wang et al[8] studied the internal flow field characteristics of a single fuel nozzle in a large-scale turbojet engine, as well as the flow distribution at the nozzle outlet.
The fuel distribution uniformity of the injection ring in micro-turbojet engines directly affects combustion efficiency and engine performance. While existing research mostly focuses on large-scale engines or single-parameter optimization, research on the structural adaptability of nozzles for micro-scale engines remains insufficient. In this paper, the Leiting LT70 is used as the test prototype. By quantifying characteristic non-uniformity parameters, the coupled effect of nozzle inner diameter and inlet flow rate is systematically analyzed, which provides an accurate basis for the optimal design of injection rings for micro-turbojet engines.
1 Modeling and Simulation
1.1 Establishment of Physical Model
The geometric model of the fuel injection ring was established in SolidWorks, as shown in Fig. 1. The fuel injection ring is composed of a ring body, a fuel inlet tube, and 12 fuel nozzles equidistantly arranged along the circumferential direction of the ring. For the ring body, the inner diameter is 2.5 mm, the wall thickness is 0.5 mm, and the pitch diameter
  is 120 mm. For the fuel inlet tube, the length
  is 118 mm, the inner diameter
  is 2 mm and the wall thickness is 0.2 mm. For the nozzles, the length
  is 16 mm, the wall thickness of 0.1 mm, and the inner diameters
  range from 300 μm to 900 μm.
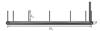 |
Fig. 1 Fuel injection ring fluid dimensional parameters |
The three-dimensional geometric model was imported into ANSYS Fluent to establish the physical model for fluid computation, as shown in Fig. 2.
 |
Fig. 2 Fuel injection ring fluid calculation physical model |
1.2 Boundary Conditions and Mesh Division
In the Fluent pre-processing, the boundary conditions were set as follows: the fuel inlet pipe cross-section as a mass flow inlet, the nozzle outlet cross-section as a constant pressure outlet, and the remaining surfaces as no-slip walls. Aviation kerosene was used as the fuel, a hydrocarbon mixture with an average formula of  , a density of
  , and a viscosity of
  . The local mesh of the internal flow field of the fuel injection ring is shown in Fig. 3. Unstructured tetrahedral meshes were employed, offering good geometric adaptability and ease of mesh size control.
 |
Fig. 3 Local mesh model |
1.3 Numerical Method and Grid Independence Verification
In this study, the semi-implicit method for pressure-linked equations (SIMPLE) algorithm is adopted for pressure-velocity coupling, and the renormalization group (RNG) k-ε turbulence model is used to accommodate relatively complex flows. In numerical simulation calculations, it is assumed that the fuel is an incompressible fluid with three-dimensional, steady-state flow, and energy conversion during fuel flow is not considered. In this study, the nozzle diameters are all greater than 50 μm, which complies with the continuous medium assumption. So the continuity equation and numerical calculation methods based on the Navier-Stokes equation[9] can be used. The equations are as follows:
Continuity Equation:
 (1)
(1)
Navier-Stokes Equations:
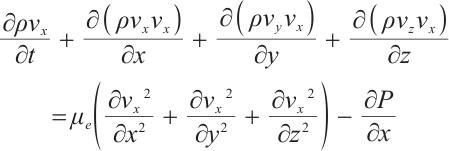 (2)
(2)
 (3)
(3)
 (4)
(4)
In these equations: 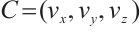 represents the velocity vector,
  represents the effective viscosity,
  represents the fuel density, and P represents the pressure.
A pressure-based solver is adopted as the solver, and the pressure-velocity coupling calculation uses the SIMPLE algorithm. For the turbulent flow phenomena occurring during fuel flow, a turbulence model needs to be added before the solution calculation. In this study, the RNG k-ε turbulence model is adopted to accommodate relatively complex flows. When the solved residual value of the continuity equation is less than 1×10⁻⁵, the calculation is considered converged, and the calculation results are highly accurate[10]. Figure 4 shows the convergence history of the residuals for the continuity equation, the velocity components in all three directions, the turbulent kinetic energy (k), and the turbulent dissipation rate (ε).
 |
Fig. 4 Iterative calculation results |
Before numerical simulation calculations, grid independence verification is necessary. In this paper, a fuel injection ring with a nozzle diameter of 450 μm for numerical simulation is adopted. The inlet flow rate is set at  , and the grid is divided into varying numbers ranging from 350 000 to 1 200 000. The results of grid independence verification are shown in Table 1. When the number of grids reaches 603 678 or above, the maximum change in fuel inlet pressure is 0.02 kPa. To minimize the impact of the number of the grids on the accuracy of the solution, the number of grids in all numerical simulation schemes is 600 000 or above, and according to the structural differences of different fuel injection ring models, the corresponding number of grids is between 600 000 and 1 500 000.
Grid independence verification results for a nozzle diameter of 450 μm
2 Case Analysis
2.1 Parameter Settings
This study investigates the effects of nozzle inner diameter and inlet flow rate on the fuel flow distribution at the nozzle outlets of the injection ring. Seven nozzle inner diameters (300, 400, 500, 600, 700, 800, and 900 μm) and eight inlet mass flow rates (5, 10, 20, 30, 50, 100, 200, and 300 g/min) were examined, yielding a total of 56 simulation cases.
2.2 Simulation Results and Analysis
When the inlet mass flow rate remains constant at  , the fuel flow distribution at the outlets of the fuel injection ring nozzles is shown in Fig. 5. It can be observed that the fuel flow distribution at the outlets of nozzles with an inner diameter of 300 μm is relatively uniform. As the inner diameter of the nozzles gradually increases to 900 μm, the outlet mass flow rates of nozzles No. 1 and No. 2 are larger, while the outlet mass flow rates of nozzles No. 6 and No. 7 are smaller.
 |
Fig. 5 Fuel distribution at an inlet mass flow rate of 
|
To better analyze and compare the uniformity of the fuel distribution at the nozzles' outlets, the normalized mass flow rate is utilized to analyze the fuel distribution. The calculation expression for this is shown in formula (5):
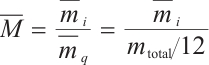 (5)
(5)
In the formula,  denotes the normalized mass flow rate,
  denotes the actual outlet mass flow rate of the nozzle,
  denotes the average outlet mass flow rate, and
  denotes the inlet mass flow rate.
Under different inlet mass flow conditions, the normalized mass flow distribution at the nozzle outlets is shown in Fig. 6. When the nozzle diameter of the fuel injection ring is 300 μm, the normalized mass flow rate is close to 1, as shown in Fig. 6(a). When the nozzle diameter is 600 μm, the normalized mass flow rate is slightly greater than 1, among them, the nozzles No. 1 and No. 12 have relatively large deviations, and the maximum deviation of the nozzle No. 12 is 7.1%. When the nozzle diameter is 900 μm, the deviations are larger, with a maximum deviation of 29.4%, as shown in Fig. 6(c) and (d). It can be seen that the greater the distance between the nozzle and the inlet oil pipe opening, the smaller the outlet fuel flow rate. And as the nozzle diameter increases, the unevenness of the outlet flow rate among the nozzles of the fuel injection ring increases.
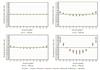 |
Fig. 6 Results of normalized mass flow rate distribution under different conditions |
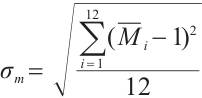
To quantitatively evaluate the uniformity of the fuel distribution at the nozzle outlets, the non-uniformity parameter of nozzle outlet flow rate is introduced:
 (6)
(6)
The results of the non-uniformity parameter of nozzle outlet flow are shown in Fig. 7. As the nozzle diameter increases, the non-uniformity parameter also increases. When the nozzle diameter is 900 μm, the non-uniformity parameter reaches a maximum of 16.5%. In other words, the larger the nozzle diameter of the fuel injection ring and the smaller the inlet mass flow rate, the greater the difference in fuel flow rate at each nozzle outlet, resulting in the more uneven fuel flow distribution. When the inlet fuel mass flow rate is 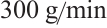 , as the nozzle diameter gradually increases, the non-uniformity parameter of outlet flow is no more than 8.1%, indicating that when the inlet flow rate is large, the fuel flow rate difference decreases as nozzle diameter increases, and the fuel flow distribution is relatively uniform. When the nozzle diameter of the fuel injection ring is 300 μm, the maximum non-uniformity parameter of each outlet flow is 0.42%, and the inlet flow rate has a relatively small impact on the uniformity of fuel flow distribution, resulting in a relatively uniform fuel flow distribution.
 |
Fig. 7 Results of non-uniformity parameters for different inlet flow rates and nozzle diameters |
In addition, the pressure drop between the inlet and outlet of the fuel injection ring was obtained through numerical simulation, as shown in Fig. 8. As the nozzle diameter of the fuel injection ring increases, the pressure drop between its inlet and outlet rapidly decreases. When the inlet flow rate of the fuel injection ring remains constant, a smaller nozzle diameter results in a larger pressure drop. The maximum pressure drop between the inlet and outlet of a fuel injection ring with a nozzle diameter of 300 μm is 217.3 kPa, while that of a fuel injection ring with a nozzle diameter of 900 μm is 14.9 kPa at its maximum. This indicates that the pressure drop between the inlet and outlet of the fuel injection ring increases as the nozzle diameter decreases.
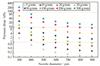 |
Fig. 8 Pressure drop across the inlet and outlet of various fuel injection rings |
Considering both the fuel flow distribution at the nozzle outlet of the fuel injection ring and the pressure drop between the inlet and outlet, for a nozzle inner diameter of 500 μm, the maximum non-uniformity parameter of the outlet flow is 2.4%, and the maximum pressure drop between the inlet and outlet is 41.4 kPa. For a nozzle inner diameter of 600 μm, the maximum non-uniformity parameter of the outlet fuel flow is 4.1%, and the maximum pressure drop between the inlet and outlet is 26.2 kPa. The non-uniformity parameter of the outlet flow for a nozzle inner diameter of 600 μm does not exceed 5%, indicating a relatively uniform fuel flow distribution. Therefore, considering the uniformity of fuel distribution at the nozzle outlet of the fuel injection ring and the power consumption of the fuel pump, a fuel injection ring with a nozzle inner diameter of 600 μm is more suitable for supplying fuel to the combustion chamber of this micro-turbojet engine.
3 Conclusion
This study numerically investigated the effects of nozzle inner diameter and inlet flow rate on the fuel flow distribution of injection rings in micro-turbojet engines using the RNG k-ε turbulence model. The results show that reducing the nozzle inner diameter and increasing the inlet flow rate lead to a more uniform fuel flow distribution at the nozzle outlets. For a nozzle diameter of 300 μm, the non-uniformity parameter remains stable across varying inlet flow rates, indicating robust distribution uniformity. Conversely, larger nozzle diameters or lower inlet flow rates result in increased flow unevenness. The pressure drop between the inlet and outlet increases with decreasing nozzle diameter and increasing flow rate. Specifically, the pressure drop for a 300 μm nozzle is approximately ten times that for a 900 μm nozzle. Taking both distribution uniformity and pressure drop into account, a fuel injection ring with a nozzle inner diameter of 600 μm is optimal for the micro-turbojet engine discussed in this paper.
References
- Xue R R, Li F C. An overview on development of micro turbojet engines[J]. Advances in Aeronautical Science and Engineering, 2016, 7(4): 387-396(Ch). [Google Scholar]
- Kavuri C, Koci C, Anders J, et al. Experimental and computational study comparing conventional diesel injectors and diverging group hole nozzle injectors in a high temperature pressure vessel and a heavy-duty diesel engine[J]. International Journal of Engine Research, 2023, 24(3): 769-792. [Google Scholar]
- Gao Q, Li J H, Zhang Y X. Self-tuning speed and flow control of micro turbojet engines based on an improved evolutionary strategy[J]. Automatika, 2024, 65(3): 1154-1162. [Google Scholar]
- Lamoot L, Manescau B, Chetehouna K, et al. Experimental study on the cavitation phenomenon effect on the efficiency of a turbulent premixed flame kerosene/air[J]. Experimental Thermal and Fluid Science, 2024, 154: 111170. [Google Scholar]
- Do K H, Kim T, Han Y S, et al. Investigation on flow distribution of the fuel supply nozzle in the annular combustor of a micro gas turbine[J]. Energy, 2017, 126: 361-373. [Google Scholar]
- Enagi I I, Al-attab K A, Zainal Z A. Liquid fuels spray and combustion characteristics in a new micro gas turbine combustion chamber design[J]. International Journal of Energy Research, 2019, 43(8): 3365-3380. [Google Scholar]
- Tan K, Wang Y, Zhang F, et al. Optimum design of injection ring for micro-turbojet engine[J]. Advances in Aeronautical Science and Engineering, 2018, 9(3): 382-387(Ch). [Google Scholar]
- Wang F, Lei Y, Yang H. Numerical simulation of 3-D flow field in an aeroengine combustor nozzle-loop[J]. Journal of Aerospace Power, 2007, 22(9): 1439-1443(Ch). [Google Scholar]
- Papkov V, Shadymov N, Pashchenko D. CFD-modeling of fluid flow in Ansys Fluent using Python-based code for automation of repeating calculations[J]. International Journal of Modern Physics C, 2023, 34(9): 2350114. [Google Scholar]
- Sarkar S, Rawat B. Numerical simulation of pseudoplastic fluid flow over a square cylinder using ansys fluent[J]. International Journal of Fluid Mechanics Research, 2024, 51(6): 43-52. [Google Scholar]
All Tables
All Figures
|
Fig. 1 Fuel injection ring fluid dimensional parameters |
| In the text | |
|
Fig. 2 Fuel injection ring fluid calculation physical model |
| In the text | |
|
Fig. 3 Local mesh model |
| In the text | |
|
Fig. 4 Iterative calculation results |
| In the text | |
|
Fig. 5 Fuel distribution at an inlet mass flow rate of
|
| In the text | |
|
Fig. 6 Results of normalized mass flow rate distribution under different conditions |
| In the text | |
|
Fig. 7 Results of non-uniformity parameters for different inlet flow rates and nozzle diameters |
| In the text | |
|
Fig. 8 Pressure drop across the inlet and outlet of various fuel injection rings |
| In the text | |
Current usage metrics show cumulative count of Article Views (full-text article views including HTML views, PDF and ePub downloads, according to the available data) and Abstracts Views on Vision4Press platform.
Data correspond to usage on the plateform after 2015. The current usage metrics is available 48-96 hours after online publication and is updated daily on week days.
Initial download of the metrics may take a while.