| Issue |
Wuhan Univ. J. Nat. Sci.
Volume 30, Number 4, August 2025
|
|
|---|---|---|
| Page(s) | 392 - 404 | |
| DOI | https://doi.org/10.1051/wujns/2025304392 | |
| Published online | 12 September 2025 | |
CLC number: TU433
Deformation Monitoring Technology and Early Warning Management for Large-Scale Railway Adjacent Operating Lines
大型铁路邻近运营线的变形监测技术和预警管理
1
College of Design and Engineering, National University of Singapore, Singapore 119077, Singapore
2
School of Energy and Power Engineering, Xi'an Jiaotong University, Xi'an
710000, Shaanxi, China
3
China Railway Seventh Bureau Group Third Engineering Co., Xi'an
710000, Shaanxi, China
4
China Railway First Bureau Group Construction and Installation Engineering Co., Xi'an
710000, Shaanxi, China
† Corresponding author. E-mail: This email address is being protected from spambots. You need JavaScript enabled to view it.
Received:
9
January
2025
Abstract
This study employs deformation monitoring data acquired during the construction of the Haoji railway large-scale bridge to investigate the displacement behavior of the subgrades, catenary columns, and tracks. Emphasis is placed on data acquisition and processing methods using total stations and automated monitoring systems. Through a comprehensive analysis of lateral, longitudinal, and vertical displacement data from 26 subgrade monitoring points, catenary columns, and track sections, this research evaluates how construction activities influence railway structures. The results show that displacement variations in the subgrades, catenary columns, and tracks remained within the established alert thresholds, exhibiting stable deformation trends and indicating that any adverse environmental impact was effectively contained. Furthermore, this paper proposes an early warning mechanism based on an automated monitoring system, which can promptly detect abnormal deformations and initiate emergency response procedures, thereby ensuring the safe operation of the railway. The integration of big data analysis and deformation prediction models offers a practical foundation for future safety management in railway construction.
摘要
本研究利用浩吉(浩勒报吉至吉安)铁路大型桥梁施工期间获取的变形监测数据,探讨了路基、接触网支柱及轨道的位移行为。重点研究了使用全站仪和自动化监测系统的数据采集与处理方法。通过对26个路基监测点、接触网支柱及轨道区段的横向、纵向和竖向位移数据进行全面分析,评估了施工活动对铁路结构的影响。结果表明,路基、接触网支柱及轨道的位移变化均保持在预设的预警阈值内,呈现出稳定的变形趋势,表明任何不利的环境影响均得到了有效控制。此外,本文提出了一种基于自动化监测系统的预警机制,能够及时检测异常变形并启动应急响应程序,从而确保铁路的安全运营。本研究通过将大数据分析与变形预测模型相结合,为未来施工过程中实施安全措施提供了坚实的科学依据。
Key words: large-scale railway / deformation monitoring / automated monitoring / early warning mechanism
关键字 : 大型铁路 / 变形监测 / 自动化监测 / 预警机制
Cite this article: HU Mingjie, WANG Pan, HU Gaofeng, et al. Deformation Monitoring Technology and Early Warning Management for Large-Scale Railway Adjacent Operating Lines[J]. Wuhan Univ J of Nat Sci, 2025, 30(4): 392-404.
Biography: HU Mingjie, female, Master candidate, research direction: infrastructure digital management. E-mail: This email address is being protected from spambots. You need JavaScript enabled to view it.
© Wuhan University 2025
 This is an Open Access article distributed under the terms of the Creative Commons Attribution License (https://creativecommons.org/licenses/by/4.0), which permits unrestricted use, distribution, and reproduction in any medium, provided the original work is properly cited.
0 Introduction
With the continuous expansion of the high-speed railway network, the increasing number of intersection projects between newly constructed and existing lines has made ensuring structural safety and durability during construction a core issue in railway engineering[1]. In large-scale railway projects, the unique spatial layout of pile cap excavation pits, particularly at critical junctions traversing complex geological formations, often presents technical challenges, such as the encroachment of embankment slope toes, imposing higher demands on engineering techniques and management. For instance, in the construction of large bridges, engineering activities such as pier foundation excavation, mass concrete pouring, and the operation of heavy construction machinery may significantly alter the stress and displacement fields of the surrounding soil. These changes can further induce a series of engineering issues, including uneven railway subgrade settlement, lateral displacement, catenary column tilting, and track geometry deformations[2-3]. When the magnitude of these deformations exceeds the permissible thresholds set by regulations, they may not only affect track smoothness and the reliability of catenary power supply but also pose severe threats to train operation safety, potentially causing service disruptions, economic losses, and even casualties. Therefore, under complex terrain conditions, the application of advanced deformation monitoring technologies for real-time construction monitoring and early warning has become a crucial technical safeguard to ensure the safety of railway infrastructure construction[4].
In railway deformation monitoring, Fiber Bragg Grating sensors offer advantages, such as high precision and immunity to electromagnetic interference, and the capability for distributed measurements. These sensors enable real-time monitoring of structural parameters, such as strain and temperature, allowing for the calculation of deformation[5]. Additionally, satellite remote sensing technologies, including Global Navigation Satellite System, Interferometric Synthetic Aperture Radar, and the Bei Dou Navigation Satellite System, have been extensively applied to deformation monitoring[6-7]. However, in complex environments characterized by strong electromagnetic interference and adverse weather conditions, the precision and reliability of certain sensors may be compromised, making it challenging to ensure monitoring accuracy[8]. Total stations, equipped with high-precision angle and distance measurement capabilities, can accurately determine the three-dimensional coordinate changes of monitoring points[9]. Furthermore, the integration of total stations with industrial control computers facilitates automated data acquisition and transmission, enabling real-time feedback of monitoring data to processing centers[10]. The synergy of these two systems significantly enhances monitoring efficiency, ensuring the timeliness and accuracy of the data. This approach overcomes the limitations of traditional manual monitoring, such as low efficiency and poor timeliness, enabling deformation monitoring to adapt to the dynamic changes encountered during bridge construction and operation[11].
Drawing on the construction of a large-scale bridge spanning the Haoji (Haolebaoji-Ji'an) railway, this study proposes and implements a scientifically robust deformation monitoring program. The primary objective is to safeguard existing railway structures during construction through real-time monitoring and data analysis, while simultaneously providing reliable data support and decision-making references. To achieve this, total station and industrial control computer technologies are integrated into an automated monitoring system designed to comprehensively and accurately capture displacement data at critical points, such as subgrades, tracks, and catenary columns, throughout the construction process. Addressing the substantial volume of monitoring data accumulated under different construction stages and conditions, the research team employs big data analysis methods to investigate the dynamic patterns of structural deformation. Moreover, a deformation prediction model has been established based on these monitoring data, allowing proactive forecasting of bridge deformation, transitioning from passive monitoring to an active early-warning approach, and from "post-event analysis" to "preemptive prevention". In addition, the study proposes practical monitoring and early warning measures that allow for the timely assessment of structural safety, ensuring that deformations remain within manageable limits and reduce potential risks. These timely and accurate forecasts of possible incidents markedly enhance the safety and sustainability of high-speed railway construction projects.
1 Methods
The railway large-scale bridge spans a total length of 2 280.82 m, consisting of 531 bored piles and 68 piers and abutments. The project covers the section from K81+463.47 to K82+463.47 and intersects the Haoji railway at center point K1116+772.25. The newly constructed railway forms an angle of 33° with the Haoji railway, and a (60+100+60)-meter T-beam rotational construction scheme was adopted. The bridge rotation was completed by turning 33° clockwise. The project encountered complex terrain, topography, and geological conditions, presenting significant construction challenges. The excavation depth of the pier foundation pits ranged from approximately 3.64 to 5.85 m. Given the proximity to the operational line of the railway, a protective support system using bored piles was implemented to ensure construction safety. Figure 1 illustrates the spatial relationship between the existing railway line and the newly constructed railway, providing a clear visualization of their intersecting layout.
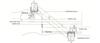 |
Fig. 1 The railway existing location relationship map |
1.1 Monitoring Methods
A range of specialized monitoring instruments, including total stations, levels, and inclinometers, were deployed throughout the large-scale railway bridge and its surrounding environment to facilitate real-time monitoring of critical components such as subgrades, catenary columns, and tracks. Routine data collection ensured both the timeliness and accuracy of the monitoring results. Additionally, by integrating automated monitoring technologies, the study achieved remote, real-time surveillance of key monitoring points, thereby substantially enhancing monitoring efficiency and precision. Continuous deformation monitoring throughout construction allowed a thorough assessment of how pier foundation construction influenced adjacent railway subgrades, tracks, and soils, to assess if deformation exceeded allowable limits due to construction activities. Furthermore, during the operational phase, this monitoring data not only provided substantial support for railway maintenance and repairs, but also effectively warned of potential safety risks. Consequently, both the newly constructed railway and the existing railway were able to operate safely, averting deformation-related incidents and providing a solid reference for necessary protective actions.
1.1.1 Monitoring equipment and targets
This study defined a monitoring region centered on the foundation caps of Piers 29 and 30 of the large-scale bridge, extending 50 m in both directions along the subgrade and totaling 100 m in length. Within this region, real-time, high-precision deformation monitoring was carried out on key components such as the subgrades, catenary columns, and tracks. The collected data encompassed horizontal and vertical displacements, and the horizontal displacement data reflect variations in both lateral and longitudinal displacements, while vertical displacement indicates changes in both vertical movement and tilt. The combined effects of these displacements collectively influence the geometric alignment of the track and the overall stability of the structure. The data is then analyzed to identify deformation trends and promptly detect any anomalies, allowing for timely implementation of corrective measures. Table 1 presents an overview of the monitoring instruments employed and their respective parameters.
Monitoring devices used in the study
1.1.2 Monitoring point layout
A total of 13 monitoring points for horizontal and vertical displacement were positioned on each side of the railway subgrade. The arrangement of subgrade monitoring points is depicted in Fig 2. Because the vertical and horizontal displacement measurements were co-located at these points, a total of 26 L-shaped prisms were ultimately installed.
 |
Fig. 2 Layout of subgrade monitoring points |
Within the monitoring section, each catenary column was equipped with two L-shaped prism monitoring points. As illustrated in Fig. 3, these prisms were affixed to the subgrade-facing outer side of each catenary support column using custom clamps to ensure stability and prevent detachment, with an approximate spacing of 2 m between them. Vertical and horizontal displacement monitoring points were co-located at the same position.
 |
Fig. 3 Catenary column monitoring point arrangement |
On each side of the railway tracks, 13 monitoring points for horizontal and vertical displacement were installed on the sleepers, with vertical and horizontal measurements co-located at each point, thus requiring the installation of 26 L-shaped prisms in total. Installation details are specified in Fig. 4. The track monitoring points were aligned with the subgrade monitoring points on the same cross-section.
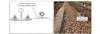 |
Fig. 4 Layout of track monitoring points |
The monitoring projects and the number of monitoring points used in this study are summarized in Table 2.
Figure 5 illustrates the schematic plan layout of the monitoring points used in this study.
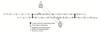 |
Fig. 5 Layout of monitoring points |
Monitoring projects and number of monitoring points
1.1.3 Monitoring frequency
Based on the horizontal and vertical displacement of monitoring targets, the deformation monitoring frequency for each stage of railway construction is summarized in Table 3.
Frequency of deformation monitoring
1.2 Data Collection and Processing
Mathematical statistical analysis methods were employed to process the substantial amount of deformation data gathered, thereby deriving parameters such as displacement variation, deformation rate, and cumulative deformation[12]. Data visualization techniques were then utilized to produce deformation curves and contour maps, offering an intuitive depiction of deformation characteristics and enabling an in-depth analysis of underlying deformation patterns and trends[13]. Moreover, grounded in structural mechanics and geotechnical engineering principles, mechanical models of the bridge structure and its surrounding environment were developed[14-15]. These models simulated and analyzed deformation under various working conditions, and their results were cross-validated and supplemented by actual monitoring data.
Horizontal displacement monitoring data were acquired using a total station, primarily capturing changes in the planar coordinates of the monitoring points. During each observation, the total station's high-precision angle and distance measurement capabilities were employed to accurately determine the angles and distances between the monitoring points and the measurement station. By incorporating the known coordinates of the measurement station and applying triangulation principles, real-time planar coordinates of the monitoring points were subsequently calculated. The displacement variations of these points in the longitudinal and transverse directions of the railway were then derived by computing the differences between current and previous coordinates and transforming these differences into the railway's dedicated longitudinal and transverse coordinate system. To maintain data accuracy, measurements were performed under stable meteorological conditions, such as early morning or evening, to mitigate the impacts of direct sunlight and temperature fluctuations. Furthermore, each monitoring point was measured multiple times, and the average value was used as the final observation, thereby minimizing measurement errors and enhancing the reliability and accuracy of the collected data.
Vertical displacement data were primarily obtained using a level and the leveling method to track elevation changes at monitoring points. Stable leveling benchmarks were established within the monitoring area to serve as elevation references. Employing the level, the height differences between each monitoring point and these benchmarks were measured sequentially, and the elevations of the monitoring points were derived accordingly. Differences in elevation values across different observation periods were used to determine settlement for each stage, and dividing the settlement by the corresponding observation time interval yielded the deformation rate. Cumulative settlement was obtained by summing the settlement values from all observation periods. Strict adherence to leveling measurement standards ensured accuracy. Equal foresight and backsight distances were maintained to minimize errors caused by misalignment between the instrument's collimation axis and leveling tube axis. Closed leveling loops or compound leveling routes were employed to ensure measurement closure and continuity, and further adjustment calculations were carried out to improve precision and reliability. Collectively, these measures guaranteed the accuracy of vertical displacement data, furnishing a robust foundation for subsequent deformation analyses and structural safety assessments.
1.3 Deformation Analysis
During the construction phase, the collected data underwent validity checks to eliminate outliers caused by instrument malfunctions or human errors. The data were then categorized and archived according to factors, such as monitoring projects, monitoring point IDs, and observation times, and compiled into a dedicated database to guarantee standardized, systematic data management. Statistical analysis techniques were employed to compute key metrics, including the mean, standard deviation, and maximum and minimum values of various deformation parameters. These metrics were subsequently used to produce deformation process curves (e.g., displacement-time and settlement-time curves), which offer a visual representation of temporal deformation trends and support the early detection of potential problems.
Analyzing deformation trends facilitates the evaluation of structural stability. A prompt investigation into the causes of deformation is warranted when a sudden increase in deformation rate or the presence of abnormal inflection points is detected on deformation curves. Such an investigation requires a comprehensive review of on-site construction conditions and environmental factors, thereby establishing a reliable basis for subsequent engineering decisions. For instance, at one stage of subgrade monitoring data processing, the vertical displacement rate at a specific monitoring point escalated sharply from 0.2 mm/d to 1.5 mm/d over a brief interval. On-site inspections revealed the accumulation of rainwater in the surrounding area, which elevated the moisture content of the subgrade soil, diminished its strength, and intensified subgrade settlement. In response, the construction team swiftly adopted drainage measures and reinforced the subgrade, effectively stabilizing the deformation and ensuring railway safety. By integrating data analysis with on-site feedback mechanisms, the monitoring system can quickly identify potential safety risks and implement timely remedial actions.
1.4 Monitoring and Early Warning Settings
Drawing on the Technical Specification for Safety Monitoring of Operating Railway Infrastructures with Adjacent Constructions (TB 10314-2021) and the Technical Standard for Monitoring of Building Excavation Engineering (GB 50497-2019) and taking into account the specific conditions of the project, this study defined the warning thresholds, alarm values, and control values for each monitoring item. Comprehensive details can be found in Table 4.
Monitoring of warning, alarm and control values
2 Results and Discussions
2.1 Monitoring Point Analysis
By monitoring the subgrades, catenary columns, and tracks, lateral, longitudinal, and vertical displacement data were gathered for each monitoring point. These data were subsequently analyzed and compared to evaluate the deformation behavior and underlying trends. The monitoring results show that during the construction of the foundations for Piers 29 and 30 of the railway bridge, despite significant impacts from the dynamic loads of heavy construction machinery and large-volume concrete pouring operations, the displacement of the subgrade remained minimal, the deformation of the catenary columns structure was kept at a low level, and the variations in the geometric alignment parameters of the track did not exceed the design allowable values. Throughout the monitoring period, none of the three types of monitoring indicators triggered the preset warning thresholds. These monitoring results confirm that protective measures effectively minimize deformation risks to subgrades, catenary columns, and tracks, ensuring railway operational safety.
2.1.1 Subgrade monitoring point analysis
Observations were made at 26 monitoring points measuring both horizontal and vertical displacements of the subgrade. A comparison with initial values was then carried out, and the cumulative changes at each monitoring point are summarized in Table 5.
According to the monitoring data, the lateral cumulative displacement of the subgrade's horizontal displacement ranged from -1.92 mm to 0.57 mm, with monitoring point ZLJ09 exhibiting the largest cumulative displacement of -1.92 mm yet still below the warning threshold. The longitudinal cumulative displacement ranged from -1.76 mm to 0.13 mm, with monitoring point ZLJ10 recording the highest value of -1.76 mm, which also remained within the safe range. Other monitoring points showed relatively small cumulative horizontal displacements, all of which were well within permissible limits. Regarding vertical displacement, the cumulative changes spanned from -2.52 mm to 1.22 mm, and monitoring point YLJ13 displayed the largest displacement of -2.52 mm again below the warning threshold. The vertical displacements at the remaining monitoring points were all smaller and remained within controllable boundaries. The analysis of displacement monitoring data indicates that during the construction of the new railway line, the implementation of effective engineering control measures significantly mitigated adverse effects such as soil disturbance on the existing lines. The monitoring data reveals that the displacement at each subgrade monitoring point exhibited a continuous and gradual variation, with the rate of change consistently maintained within permissible limits. No sudden shifts or abnormal fluctuations in displacement were observed. This demonstrates that the subgrade structural system maintained excellent stability during the construction period, and its deformation characteristics aligned with engineering expectations, posing no potential threat to the normal operation of the railway system.
Statistics on subgrade monitoring points (unit:mm)
2.1.2 Catenary columns monitoring point analysis
Observations were performed at five monitoring points measuring the tilt and vertical displacement of the catenary columns, with the cumulative changes at each point summarized in Table 6.
The cumulative lateral tilt ranged from -0.01% to 0.02%, with monitoring point LZ480 exhibiting the highest tilt at 0.02%, yet remaining below the warning threshold. Its cumulative longitudinal tilt ranged from -0.01% to 0.01%, with monitoring point LZ473 showing the largest tilt of 0.01%, which also fell within safe limits. Other monitoring points displayed comparatively minor cumulative tilt changes, all within the prescribed safety range. In terms of vertical displacement, the cumulative changes ranged from -0.09 mm to 0.07 mm, with LZ480 again recording the largest change of -0.09 mm, remaining below the warning threshold. Cumulative vertical displacements at the remaining monitoring points were similarly modest and stayed within controllable boundaries. Throughout the entire monitoring period, the deformation of the catenary columns remained minimal and demonstrated excellent stability characteristics. The rate of inclination changes and displacement magnitude did not exceed the design allowable thresholds, and no significant abrupt changes were observed. These monitoring results indicate that the protective measures implemented during the construction of the new railway line effectively mitigated the adverse impacts of construction activities on the catenary system, ensuring the overall stability of the catenary columns structure. This stable structural condition provides essential assurance for the reliable operation of the railway traction power supply system.
Contact network monitoring point statistics
2.1.3 Track monitoring point analysis
A total of 26 monitoring points for horizontal and vertical displacement of the track were observed. By comparing the final period data with the initial values, the cumulative displacement changes were calculated. The cumulative changes for each monitoring point are summarized in Table 7.
The cumulative lateral displacement of the track ranged from -1.75 mm to 0.54 mm, with the largest value recorded at monitoring point YGD09 (-1.75 mm), remaining below the warning threshold. Similarly, the cumulative longitudinal displacement spanned from -2.07 mm to 0.67 mm, with YGD09 again exhibiting the largest shift at -2.07 mm, which also stayed within the allowable limit. The cumulative horizontal displacements at other monitoring points were relatively small and all fell within safe parameters. As for vertical displacement, cumulative changes varied between -2.32 mm and 0.12 mm, with YGD07 presenting the greatest displacement of -2.32 mm still within the warning threshold. The other monitoring points showed smaller vertical displacements, remaining well within controllable limits. The analysis of monitoring data indicates that the displacement variations at all monitoring points exhibited favorable stability characteristics, with no abrupt changes or abnormal fluctuations observed. This demonstrates the impact of construction activities on the track structure was effectively controlled throughout the entire railway construction process. Despite vibrations and soil disturbances caused by construction activities, the track monitoring data showed minimal changes and did not trigger any warnings. The geometric alignment parameters of the track remained consistently within permissible limits.
Statistics on orbital monitoring points (unit:mm)
2.2 Early Warning Response
When monitoring data approaches or reach warning thresholds, early warning notifications must be issued promptly and systematically to ensure timely dissemination of information to all relevant stakeholders and enable the swift implementation of effective countermeasures.
2.2.1 Information instantly release
In this study, the total station, industrial control computer, and other automated monitoring devices are integrated with specialized monitoring software to facilitate precise, real-time data collection and transmission. When the monitoring data approaches the warning threshold, the software automatically activates a pop-up notification, prominently highlighted in red for immediate visibility. This notification provides detailed information, including the warning item (e.g., subgrade vertical displacement warning), the warning level (Yellow, Orange, or Red), the monitoring point ID (e.g., ZLJ09), relevant threshold values, and the current measured values. To ensure a rapid response, the system simultaneously dispatches SMS alerts to predefined phone numbers, thereby guaranteeing that key personnel receive the warning information without delay. Upon receiving a warning notification, on-site technicians must conduct manual verification using total stations or levels, compare results with automated data, and rule out potential equipment malfunctions. Once confirmed, a monitoring early warning report form must be completed, detailing the warning time, verification process, and initial site assessment.
2.2.2 Recipients of early warning information
As the primary party responsible for project implementation, the construction unit must react immediately upon receiving early warning information. The first necessary step is to suspend any construction activities that could jeopardize the integrity of railway structures, particularly high-risk operations in the warning area such as pier foundation excavation or bridge erection. Following the established emergency response plan, the construction unit allocates resources to conduct a comprehensive inspection of the warning site, identifying the root causes of the deformation and developing suitable corrective actions. These measures must be prepared and executed without delay to effectively mitigate potential risks.
Upon receiving early warning information, the railway operations management department initiates the corresponding emergency response mechanism in accordance with the warning level. Under a Yellow Warning, the department increases the inspection frequency for the relevant railway segments and closely monitors train operations to ensure safety. In the event of an Orange Warning, professional technical personnel are promptly deployed to the site to work alongside the construction unit in identifying and mitigating potential hazards; if necessary, measures such as speed restrictions or modifications to the operational sections are implemented. Should a Red Warning be issued, the department will immediately shut down the affected railway segment and mobilize emergency rescue teams to ensure the safety and stability of railway operations. The construction unit coordinates resources, convenes emergency meetings with relevant stakeholders, analyzes root causes, and develops mitigation strategies. The supervision unit oversees the entire response process to ensure quality and safety.
2.2.3 Early warning handling procedure
Upon issuance of a Yellow Warning, the construction unit must dispatch technical personnel within one hour to conduct inspections. The inspection scope includes verifying the integrity of subgrade slope protection, detecting potential water leakage at bridge pier foundations, and ensuring the secure placement of bolts on guide columns. Subsequently, construction activities within a 20 m radius must be suspended, and a self-assessment of construction procedures and parameters must be carried out. Adjustments may include modifying pile drilling speed or optimizing vibration frequency during concrete pouring. A corresponding report must be submitted within four hours, with progress updates provided every 12 hours. For instance, in a previous case involving Yellow Warnings due to subgrade vertical displacement, inspections revealed localized damage to the slope protection net, leading to minor settlement. In response, the construction unit promptly repaired the net, backfilled and compacted the soil, and improved drainage systems to mitigate future risks.
When an Orange Warning is triggered, the construction unit must notify the project manager within 30 min, suspend all activities within a 50 m radius, and initiate a joint investigation. This may involve non-destructive testing of bridge structures to assess concrete quality and potential rebar corrosion, conducting on-site sampling and laboratory tests to re-evaluate subgrade mechanical properties (e.g., shear strength and compressive modulus), and inspecting the overhead wire system for conductor wear and insulator insulation performance. Based on the findings, a detailed remediation plan must be submitted within two hours, with progress updates provided every six hours. For example, in a previous Orange Warning case involving catenary columns tilting, investigations identified strong winds and construction vibrations as the primary causes. To address these issues, mitigation measures such as installing wind-resistant cables, reinforcing foundations with grout injection, and adjusting catenary columns tension were implemented to restore structural stability.
If a Red Warning is issued, the construction unit must notify management within 15 min, immediately evacuate personnel, seal off the affected area, and establish an emergency response command center within one hour to develop on-site rescue strategies. Progress must be updated every three hours. For instance, in a Red Warning scenario involving severe subgrade settlement, emergency backfilling was carried out using well-graded sand or lime-soil mixtures, with layered compaction to restore the design elevation. In cases where bridge pier deformation was critical, demolition and reconstruction were deemed necessary to ensure structural safety. Figure 6 illustrates the early warning response process in railway construction, outlining the required actions, inspection procedures, and reporting timelines for Yellow, Orange, and Red Warnings.
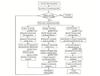 |
Fig. 6 Early warning response process for railway construction |
Throughout the entire response process, the effectiveness of each mitigation measure is continually monitored. By increasing monitoring frequency and comparing pre- and post-corrective-action data, the impact of these measures can be precisely evaluated. For instance, if a subgrade reinforcement strategy leads to a notable reduction in displacement and settlement rates signifying a move toward stabilization, this confirms its effectiveness. Likewise, when a catenary column's tilt returns to an acceptable range following rectification, it attests to the restored stability of the power supply. Should any measure prove less effective than anticipated, prompt adjustments and refinements will be implemented to ensure that railway structural safety remains within manageable limits.
3 Conclusion and Prospect
3.1 Conclusion
By systematically monitoring deformation at the large-scale bridge spanning the Haoji railway and its surrounding environment, this study formulated and carried out a scientifically rigorous monitoring program, collected a substantial volume of reliable data, and conducted comprehensive analyses. The results indicate that none of the monitored points on critical components, such as the tracks, subgrades, and catenary columns, exceeded their respective warning thresholds for displacement or settlement. Moreover, overall displacement and settlement trends remained stable throughout the monitoring period. These findings suggest that the construction of the new railway, particularly the large-scale bridge over the railway, did not generate any significant adverse effects on the structural safety of the existing railway. The deformations observed during construction were kept within controllable boundaries and complied with relevant standards. Furthermore, this study introduced a refined early-warning scheme for the automated monitoring system, enabling construction teams to detect unfavorable deformations promptly and implement precautionary measures in advance, thereby safeguarding the safety and stability of railway operations. The findings provide direct guidance for monitoring program design, emergency response planning, and risk management in similar railway construction projects, demonstrating substantial practical engineering value.
3.2 Prospect
The extensive monitoring data and analytical findings obtained in this study have offered robust support for the successful construction of the existing high-speed railway. A more in-depth examination of these monitoring data would enable further exploration of the deformation characteristics of railway bridges under complex construction conditions, thereby contributing to the refinement of structural design theories and the optimization of construction techniques. Moving forward, research efforts can be broadened in the following directions:
Proactively incorporating new technologies can greatly enhance the intelligence and automation of deformation monitoring. On one hand, leveraging the internet of things (IoT), cloud computing, and big data can be further expanded by establishing an IoT-based bridge deformation monitoring platform, enabling interconnectivity among monitoring devices, real-time data sharing, and remote control. Cloud computing's robust data storage and processing capabilities facilitate the rapid handling of massive datasets and the uncovering of underlying deformation patterns. Coupled with big data analytics, this approach underpins the development of bridge deformation prediction models, enabling highly accurate structural deformation forecasts and laying a solid foundation for preventive maintenance. On the other hand, applying artificial intelligence and machine learning algorithms in monitoring data analysis, such as using deep learning techniques to automatically detect anomalous patterns, can yield intelligent evaluations of structural safety and significantly bolster the timeliness and precision of early warnings.
Further theoretical investigations are essential to elucidate the mechanisms behind railway subgrade deformation in complex geological conditions and under specialized construction techniques. By integrating numerical simulation methods such as finite element analysis, it is possible to establish more refined models of subgrade-soil interaction that consider the soil's nonlinear properties and the dynamic influences of construction processes. These models can simulate how subgrade structures and their surrounding environments respond to different working conditions. Their predictive accuracy can then be enhanced through cross-validation against empirical monitoring data, thereby refining existing deformation prediction theories. Moreover, interdisciplinary research should be pursued to explore the fundamental drivers of subgrade deformation from various perspectives, encompassing the micro-level characteristics of materials, macro-level structural loads, and broader environmental factors. Such efforts will offer valuable theoretical insights for advancing monitoring technologies and optimizing engineering designs.
References
- Wang J, Li H, Ma C, et al. Durability evaluation for existing railway engineering: A review[J]. Railway Sciences, 2024, 3(1): 59-68. [Google Scholar]
- Wang G H, Chen W H, Cao L G, et al. Retaining technology for deep foundation pit excavation adjacent to high-speed railways based on deformation control[J]. Frontiers in Earth Science, 2021, 9: 735315. [Google Scholar]
- Gou H Y, Yang L C, Leng D, et al. Effect of bridge lateral deformation on track geometry of high-speed railway[J]. Steel and Composite Structures, 2018, 29(2): 219-229. [Google Scholar]
- Qiu E X, Xie Q, Zhao W. Structure of the railway embankment settlement forewarning system and engineering application[J]. Hydrogeology & Engineering Geology, 2008, 35(5): 116-118, 123(Ch). [Google Scholar]
- Li J, Liu Y H, Zhang J R. Simultaneous measurement of strain and displacement for railway tunnel lining safety monitoring[J]. Sensors, 2024, 24(19): 6201. [Google Scholar]
- Yuan R, Cui X W, Lu M Q, et al. A GNSS multiantenna fast millimeter-level positioning method for rail track deformation monitoring[J]. IEEE Transactions on Instrumentation and Measurement, 2024, 73: 8503708. [Google Scholar]
- Tan Q L, Xie C. Preliminary result of permafrost roadbed settlement measurement using satellite D-InSAR technology[C]//Proceedings of the International Conference on Vibration, Structural Engineering and Measurement (ICVSEM 2011). Switzerland: Trans Tech Publications, 2012: 1912-1915. [Google Scholar]
- Li Y W, Xu L R, Chen Y H, et al. Intergrated space-air-train-ground Muti-source techniques for early detection of subgrade disasters and service status of railway subgrade[J]. Geomatics and Information Science of Wuhan University, 2024, 49(8): 1392-1406(Ch). [Google Scholar]
- Kampczyk A. Measurement of the geometric center of a turnout for the safety of railway infrastructure using MMS and total station[J]. Sensors, 2020, 20(16): 4467. [Google Scholar]
- Peixian W, Zhenan M A, Yanchong S U N. Research on data automation transmission of WinCE GTS-720 total station instrument based on GPRS[J]. Science of Surveying and Mapping, 2008, 33(6): 36-38(Ch). [Google Scholar]
- Jian L, Shan X C, Fei Y, et al. Development and Application of a Remote Monitoring and Analysis System for a High-Speed Railway Subgrade Structure in Mountainous Areas[M]. Beijing: China Railway Publishing House, 2015(Ch). [Google Scholar]
- Wei H Y. Application of big data analysis and mathematical models in civil and structural engineering[C]//Proceeding of the 2024 5th International Conference on Computer Science and Management Technology. New York: ACM, 2025: 1252-1257. [Google Scholar]
All Tables
All Figures
|
Fig. 1 The railway existing location relationship map |
| In the text | |
|
Fig. 2 Layout of subgrade monitoring points |
| In the text | |
|
Fig. 3 Catenary column monitoring point arrangement |
| In the text | |
|
Fig. 4 Layout of track monitoring points |
| In the text | |
|
Fig. 5 Layout of monitoring points |
| In the text | |
|
Fig. 6 Early warning response process for railway construction |
| In the text | |
Current usage metrics show cumulative count of Article Views (full-text article views including HTML views, PDF and ePub downloads, according to the available data) and Abstracts Views on Vision4Press platform.
Data correspond to usage on the plateform after 2015. The current usage metrics is available 48-96 hours after online publication and is updated daily on week days.
Initial download of the metrics may take a while.